November 2018
Final Phase Systems (FPS) Joins the INFICON Family »
Save the Date! FabGuard User Group Meeting June 4-6, 2019 »
Come See Us at an Event Near You »
FabGuard APC v5.03.00 Release »
Simplifying FabGuard Configuration Backup »
APC Conference 2018: Legacy Control System Replacement »
APC Conference 2018: Integrating 3rd Party Sensors to Reduce Scrap Events Using FabGuard »
Restoring FabGuard Computers for 24/7 Sustaining »
Support for Microsoft OLE DB driver for SQL Server (MSOLEDBSQL) »
The Ticket System is Now HTTPS. Change Your Bookmarks! »
End-of-Life Support for FabGuard Versions and Microsoft Products »
APC Conference 2018: Integrating 3rd Party Sensors to Reduce Scrap Events Using FabGuard
This abstract was presented at the APC Conference XXX 2018.
Abstract
Excessive Silane in a chamber caused severely damaged copper lines during a very short deposition process. Previous monitoring techniques did not adequately address the problem and were not able to drive root cause determination. A FabGuard FDC solution that collects data at higher rates and incorporates additional sensor monitoring of MFCs and internal chamber valves, was able to detect root cause. FabGuard was then able to provide an automatic corrective action to safeguard processing.
Motivation
Very short deposition processes of less than 4 seconds using the Novellus C2 CVD HDP Speed Chamber were having film integrity problems which resulted in multiple wafer scrap events. Using the passive OES system we were able to see that a higher amount of Silane was entering the deposition chamber than was called for in the recipe. Given the slow sample rate available from the process equipment, the existing FDC system did not collect enough data to adequately detect the problem. Two specific scenarios were identified:
- The divert gas valve for the Silane delivery line could stick, leading to a burst of gas at a higher gas flow rate.
- The divert valve could leak and create an initial undesired film prior to the main deposition step for processing. This would cause a film chemistry problem.
Approach
GlobalFoundries® approached INFICON about utilizing FabGuard for an FDC solution that included advanced sensors. With the necessity to collect and analyze data at rates far exceeding the tool capability, FabGuard was utilized as the integration and analysis system. Testing and monitoring was performed by direct integration with an Ocean Optics OES which was added to the tool leaving the OEM OES in place. Direct connection to the Brooks GF-100 series MFCs was also included to collect data at a higher sampling frequency than the current tool sampling rate. This also allowed monitoring of the internal health parameters of the MFCs for predictive maintenance. Lastly, the analog electrical signals provided by the valves connected to the gas divert and chamber (final) gas lines were integrated into wafer monitoring runs for full fault classification of gas bursting events.
Results
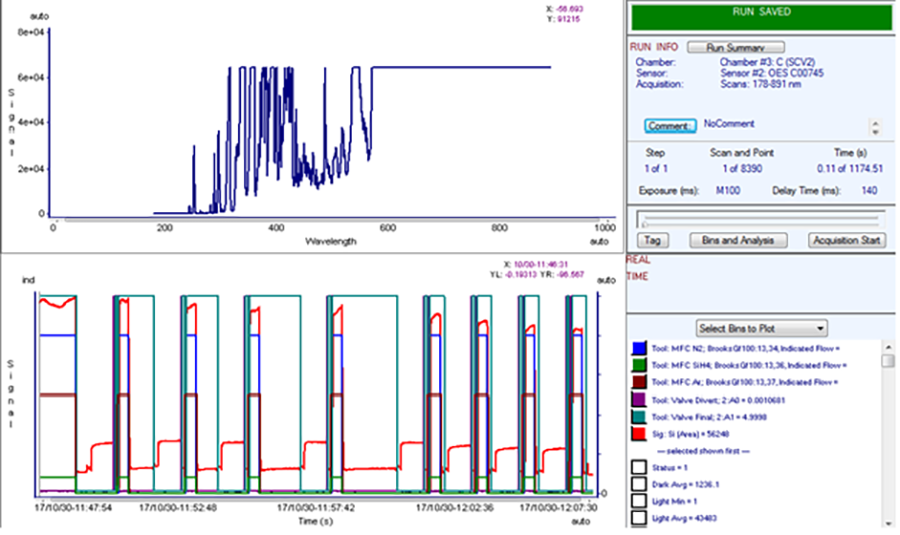
Figure 1: OES spectrum collected at 7Hz data rate.
Once the complete sensor solution was installed on the Speed Chamber, it was possible for the engineers to simulate different fault conditions by modifying their process recipe. Each of the fault conditions was able to be detected and classified with the integration of the OES data collection at a 7Hz data sampling rate along with the analog signals from the gas valves. The resulting detection and classification could now be implemented to reduce scrap from a multiple wafer event down to a single wafer per chamber event. Figure 1 shows the OES spectrum being received.
A user defined signal, labeled Si, grouped a specific window of wavelengths together for monitoring. Wavelengths outside of this analysis window were not considered critical and were ignored. The intensity of the Si signal was optimized for this application. Integration of process critical gases into wafer runs using Brooks GF-100 series MFCs was found to have a higher signal resolution than the tool was providing thru the native QNX software. Valve monitoring was integrated using the analog voltage coming from an output on the valve and embedding it into the wafer runs using National Instruments™ signal boards.
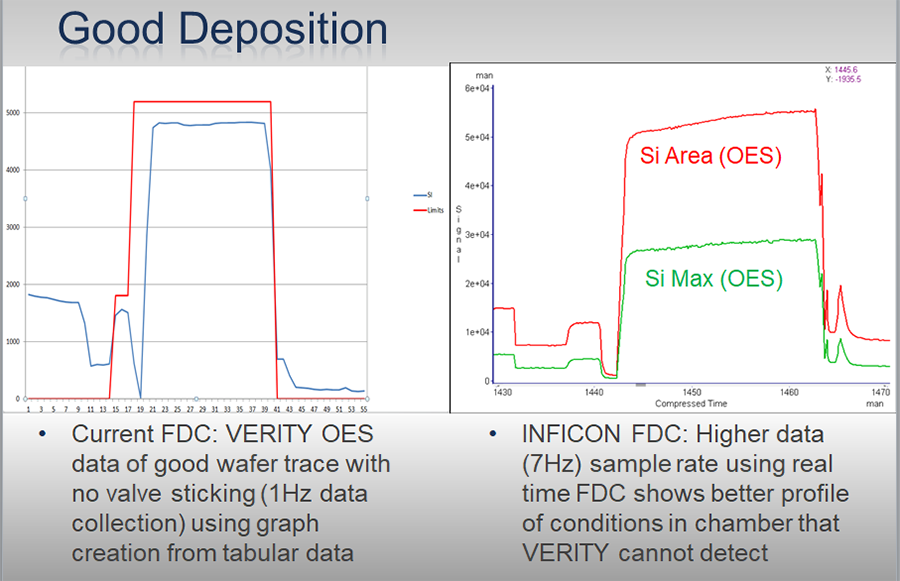
Figure 2: Data collected from the current FDC solution and the new FDC solution at 7 Hz data rate for a good deposition.
The two scenarios believed to be causing the film chemistry uniformity issue were evaluated and results from the passive OES system and the active FDC system were compared. Figure 2 shows the good deposition wafer results. The passive OES data signal for the Silane wavelength was compared to the active FDC collected Ocean Optics OES data. A reference fault line was manually incorporated into the passive OES graph to simulate capturing the signal that should result in proper fault detection.
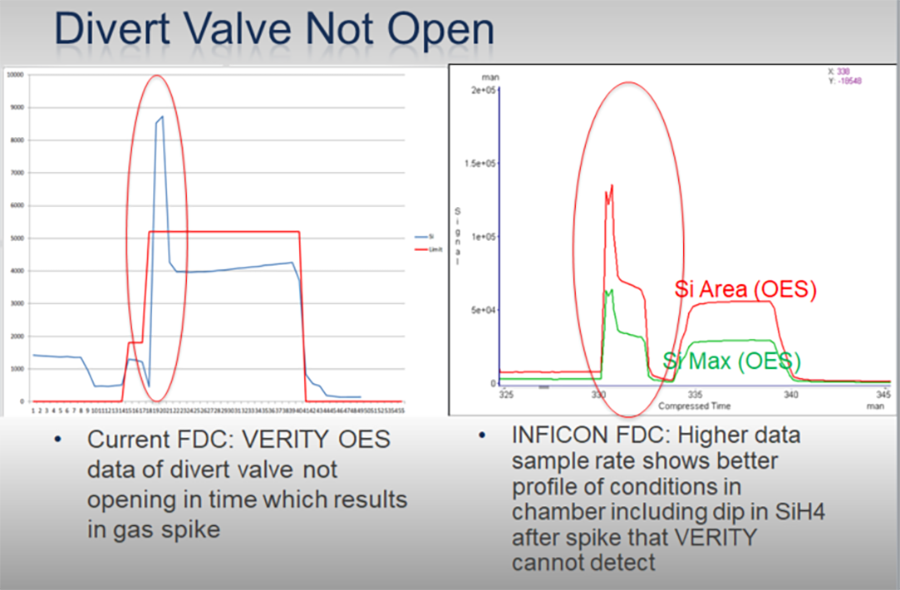
Figure 3: Data collected from the current FDC solution and the new FDC solution at 7 Hz data rate for a deposition where the divert valve did not open. |
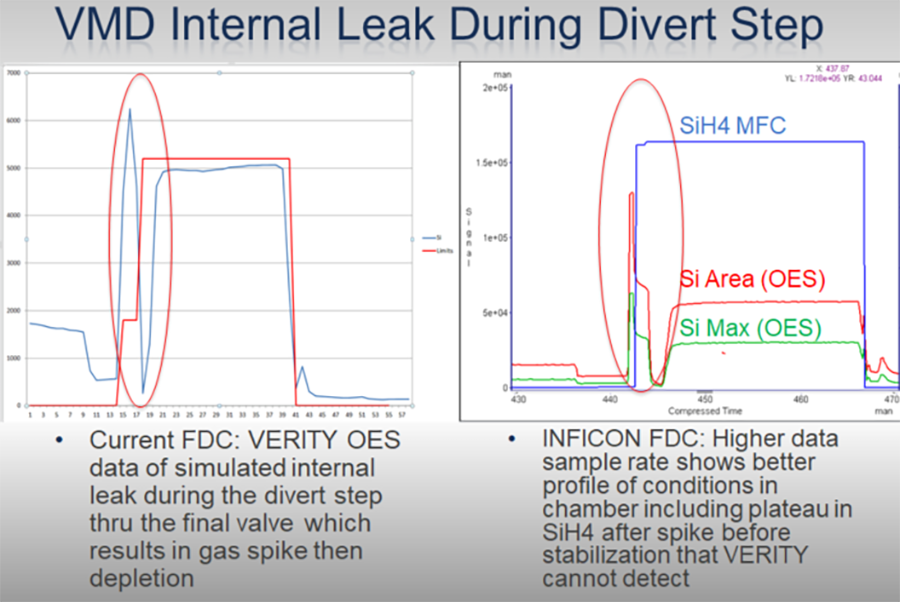
Figure 4: Data collected from the current FDC solution and the new FDC solution at 7 Hz data rate where an internal leak occurred during the divert step. |
Figures 3 and 4 show the two different fault conditions that were believed to be the cause of the film integrity issue. Figure 3 shows the data from runs where the divert valve sticks and has an undetected Si gas burst resulting in a signal spike during the initial film deposition. The increased sampling frequency of 7Hz of the Ocean Optics OES data shows a rapid initial spike in the Si gas that slightly recedes before spiking again, bottoming out, and then settling to the proper operating condition. Figure 4 shows the data from runs where the final valve is simulated to have a slight leak during the pre-processing step when all Si flow is supposed to be flowing to the divert line prior to the actual SiH4 MFC gas flow turning on for deposition.
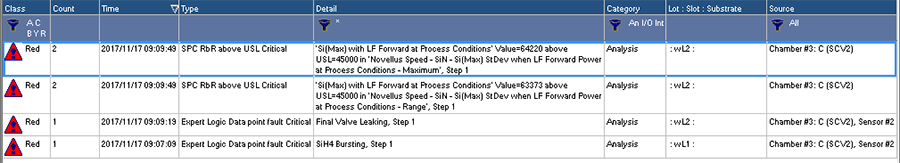
Figure 5: FabGuard automatically detects a valve issue and notifies the engineer.
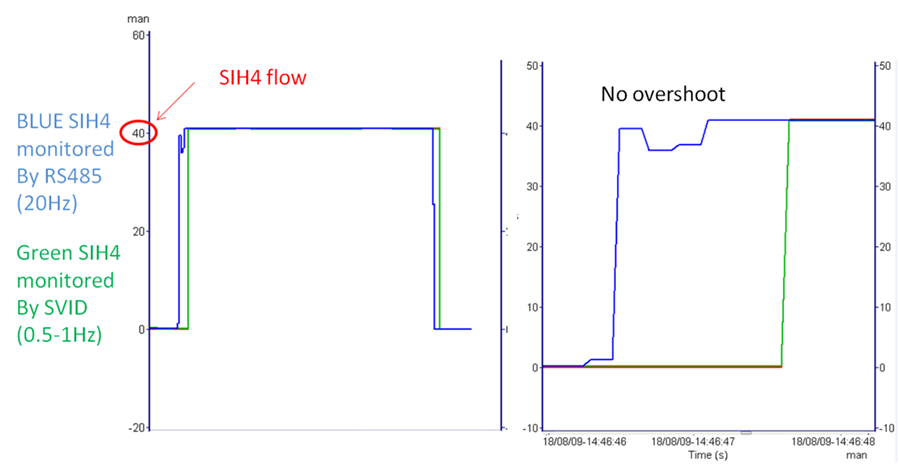
Figure 6: Direct connection to the MFC showing gas build up in the line and subsequent drop in MFC signal.
Integrating both sets of valves and the MFC gas flows into FabGuard enables proper fault detection and classification of the fault as shown in Figure 5. In the root cause determination of the issue, the direct MFC connection was measured at 20Hz (with a 5Hz response from the MFC) to determine if the MFC PID control was causing the gas to overshoot or if one of the valves was responsible. Figure 6 shows that although the SVID from the tool does not report any issue with the gas flow, direct connect to the MFC shows the gas building up pressure in the line causing a drop in the signal from the MFC (with a subsequent spike in the OES measurement when the divert valve transitions), providing the evidence that the timing sequence involved for the valves was the root cause of the issue.
Conclusion
Complete sensor integration within a wafer run allowed root cause determination of a chronic multi wafer scrap issue. By integrating OES data in real-time with the data provided using high-speed data collection of flow controllers, a fingerprint of the chamber’s normal process can be constructed and used to detect deviations from normal process and control future incidents.