TRANSLATE:
![]()
![]()
Machine Learning Envelope Models for Anomaly Detection
 |
 |
William Conner - Director of Applications, INFICON
Background
Time series anomaly detection, i.e., detecting faulty data by examining data vs. time during the process, requires the use of multiple advanced algorithms to find small, but important variations in the data without an increase in false positive rates. To address the growing need for automated anomaly detection, INFICON is focusing on combining proven statistical envelope analyses with machine learning methodology to enable more precise fault detection with less user configuration.
Why Envelope Models?
An envelope model is best suited for user interpretation. Unlike models that can only determine whether or not there is a fault, models that calculate time series envelopes are able to plot the variation in the time series data, and show when the fault occurred.
Machine Learning Time Series Envelope Model
Statistical Envelope models use historical data to determine the expected variation for each variable within each process step and for each time point across all processes. The model calculates upper and lower limits based on what is determined to be the "perfect" path of the variable in time and the observed variation in the data (Figure 1).
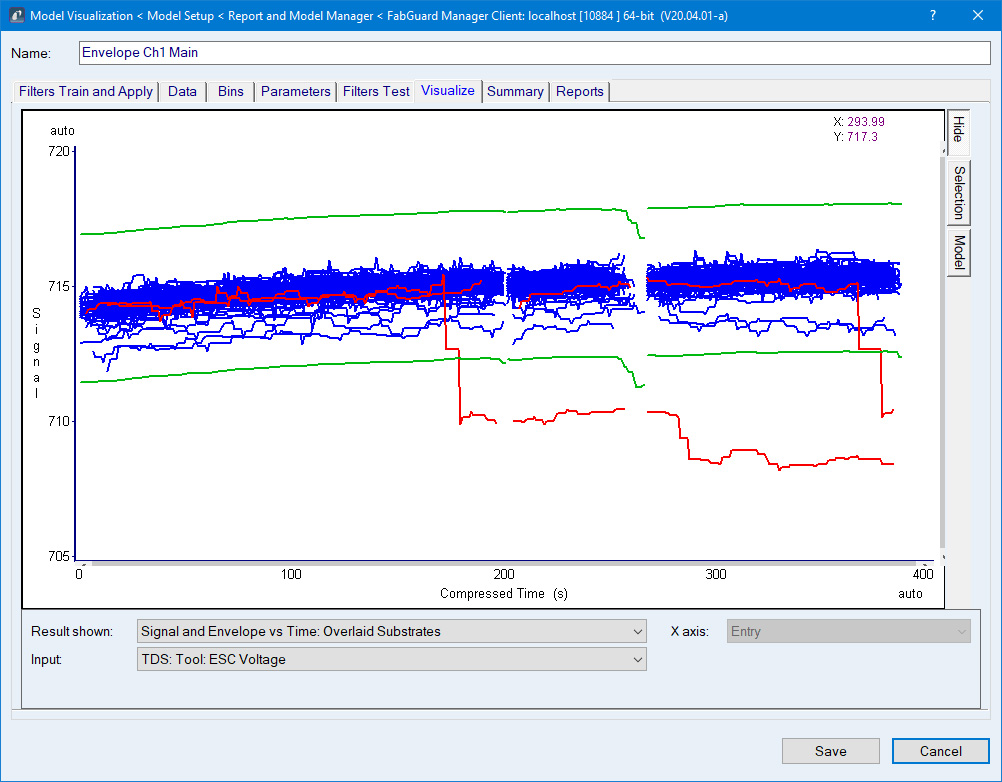
Figure 1: Time series data for a single variable in three process steps in one recipe. The training data is shown in blue, the determined envelope in green, and the identified anomalous data in red.
The Machine Learning component of the model automatically examines the data and modifies the algorithm to optimize fault detection. The models automatically:
- Use only new data at step transitions, reducing the impact of "incursion" of the previous step due to data sampling and internal tool updates
- Determine best data normalization
- Remove noise components from the data, such as oscillations, bit noise, and minimum meaningful signal
- Reduce false positives by considering the envelope limits of neighboring points
To calculate the most applicable time path for each parameter, the model classifies each parameter. The classifiers are:
- Setpoint
- Controlled (e.g., temperature)
- Actuator (e.g., heater current)
- Uncontrolled Absolute (e.g., DC bias)
- Uncontrolled Relative (e.g., optical emission endpoint)
Continuous Learning and Training of New Processes
The modeling infrastructure learns the processes running on every chamber of every tool, spawning new models, performing automated training, and tracking faults. Users no longer have to decide which processes need monitoring or remember to update analyses as new recipes are developed and new products are introduced into a fab.
The model is designed for continuous learning, and accepts user input about detected and missed faults to continuously adjust the calculated envelopes. If a fault is later identified, the model will compare external information to internal findings, and adjust itself for future anomaly detection.
Beta Testing is Underway Now
INFICON is currently partnering with several customers to beta test the time series anomaly detection model in a production environment and is planning to make it available for purchase in the first quarter of 2021.