MiniProfiler Diagnostic Tool
 |
Introduction
In March, we released Factory Dashboard version 6.6 with a new diagnostic tool called MiniProfiler. This tool helps you see which queries are used to generate the data for the page as well as how long they took to execute. It has already been useful at several of our client sites to help them understand where the data is coming from.
Example Showing Generation of Spotlight Data for the Tool State History Page
To use the MiniProfiler:
- Open your Factory Dashboard and hit Ctrl-Alt-m.
- A popup window will open that contains the timing of each component.
- Click on a row to see a summary of the timing and a link to the SQL (Figure 1).
- Click the SQL link to see the full query along with the parameters that were passed into the query (Figure 2).
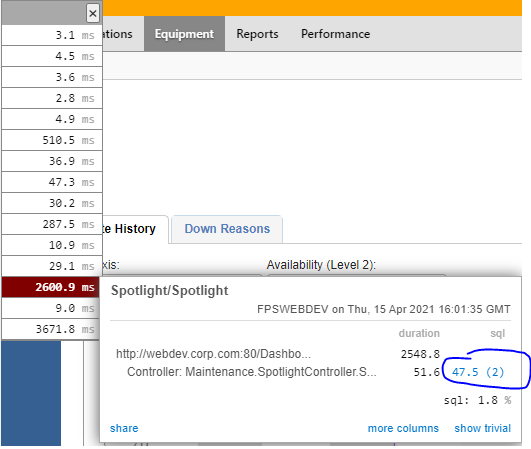
Figure 1: MiniProfiler timing drill down with the link to source SQL circled.
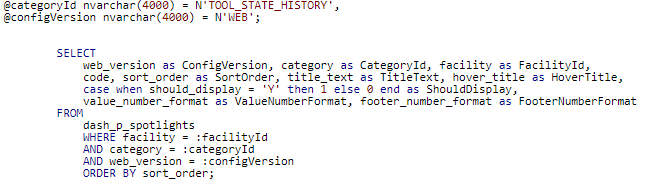
Figure 2: Full SQL query with parameters reported by the MiniProfiler.
The query in Figure 2 was used to generate spotlight data for the tool state history page. If you execute the same query in your favorite database editor, you will see the raw numbers used by the dashboard code. From there, you can browse the database to investigate the underlying source of the numbers. If you need help investigating the views and tables behind a particular query, you can refer to the database documentation on our help site or contact an INFICON apps engineer to walk you through the process.
Summary and Future Features
Use our new MiniProfiler diagnostic tool to investigate SQL queries and their execution times. The MiniProfiler is just one of many new features we have added to the Factory Dashboard this year. For those who have access to our help site and wish to learn more about our MiniProfiler and other future Dashboard enhancements, please visit our Factory Dashboard release notes and help site page.