September 2019
Welcome and FPS Product Introduction from John Behnke, General Manager »
Early Success with Factory Dashboard at MACOM »
Factory Scheduler for Backend Manufacturing »
Metrology Sampling Optimizer »
NextMove Metrics Track WIP Delivery Performance »
Factory Dashboard Lots Page Redesign »
A Data-Oriented Perspective on Progress Toward a Self-Driving Fab »
NextMove Metrics Track WIP Delivery Performance
 |
 |
Next Move Product Overview
In a typical fab without AMHS, transportation accounts for the majority of the time spent by direct labor. Much of this time is wasted on finding lots or moving them when they don't need to be moved. FPS NextMove relies on the FPS Factory Scheduler data to provide instructions to operators and material handlers on the factory floor. With its inventory tracking capabilities and real time decision making, NextMove ensures timely WIP deliveries to the next destination in the process.
For more information, visit FPS NextMove and FPS Factory Scheduler.
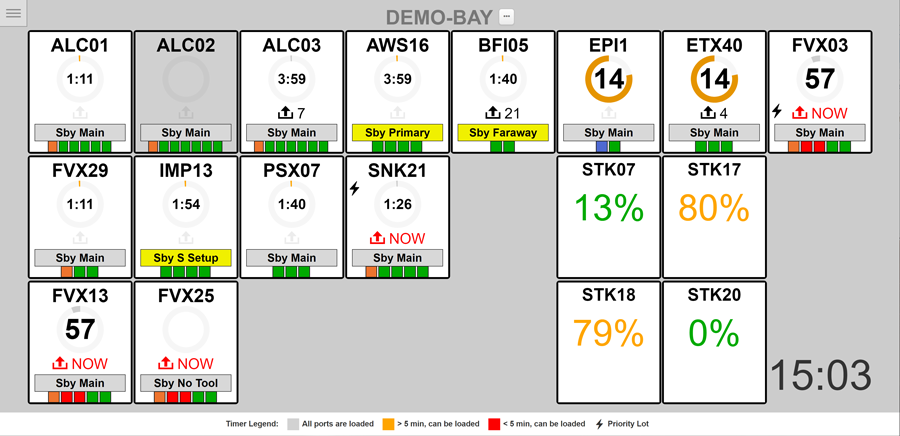
Figure 1: Example of the FPS NextMove bay screen.
New Metrics to Track WIP Delivery Performance
The NextMove delivery system relies on a system of racks and carts to stage and move carriers around the factory. Manufacturing managers need to monitor the status of those racks and carts to guarantee the most effective staging of carriers for their next process. Rack, cart, and carrier metrics are now available in the Metrics page to help managers to evaluate the manpower needed for optimal WIP movement (Figure 2.)
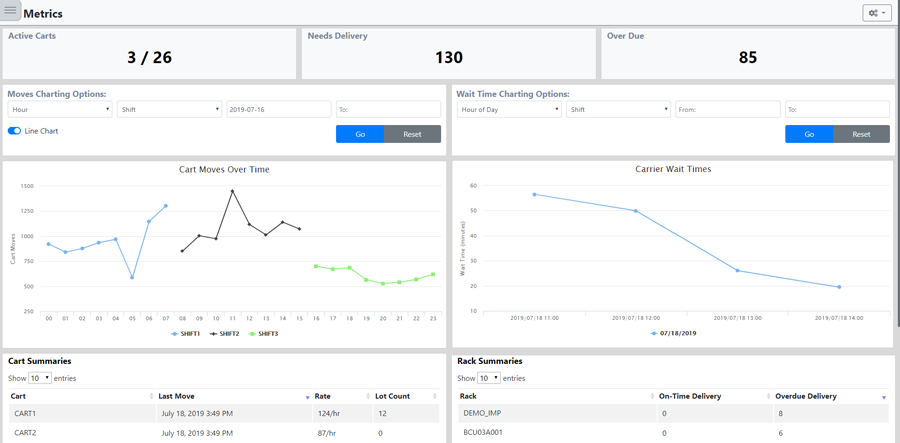
Figure 2: The new Metrics page in NextMove showing plots for Cart Moves Over Time and Carrier Wait Times. Changes in these metrics may indicate the need for increased manpower.
Key Rack, Cart, and Carrier Metrics
- Number of active carts
- Number of carriers that need delivery
- Number of overdue carriers
- Cart delivery speed
- Average wait times for carriers to be delivered
- Number of overdue carriers on each rack
Cart Moves Example
The Cart Moves Over Time plot in Figure 2 displays the number of completed carrier deliveries by shift. We can see that shift three is under performing compared to shifts one and two. The shift three manager can use the Cart Summaries table below the plot to drill down to the metrics for each cart. In this example, each cart has a high rate of delivery, the manager may need to increase the number of cart operators to improve performance.
Carrier Wait Time Example
The Carrier Wait Times plot in Figure 2 displays the average carrier wait times per hour for the current shift. In this example, carriers were sitting on a rack for an average of 60 minutes during the operator lunch hour and returned to the standard 20 minutes when they returned. If there is a spike in the Carrier Wait Times plot, the Rack Summaries table below the plot can provide information on which rack has the highest overdue lot count and should be prioritized.
Summary
Monitor the status of WIP deliveries to ensure the most effective staging of carriers for their next process using the new Metrics page in NextMove.