TRANSLATE:
![]()
![]()
SmartFDC Detects Anomalies in Chamber MFC Interaction and Backside He Flow
 |
Project Overview
INFICON partnered with two FabGuard customers to develop SmartFDC Anomaly Detection algorithms and the corresponding web user interface. This on-going project consists of 3 phases:
- Installation of development systems and connection to production SECS Multiplexers.
- Testing and refinement of the SmartFDC Anomaly Detection algorithms.
- Development of the SmartFDC Web UI.
Success 1: MFC flow on Chamber B impacts flow on Chamber C
On an industry standard PECVD cluster tool, a SmartFDC Anomaly Detection model was configured for all CVD chambers. After training the model using 500 processes to generate a preliminary detection envelope, we noticed that the anomaly scores for Chamber C were consistently high when compared to Chamber B (Figure 1).
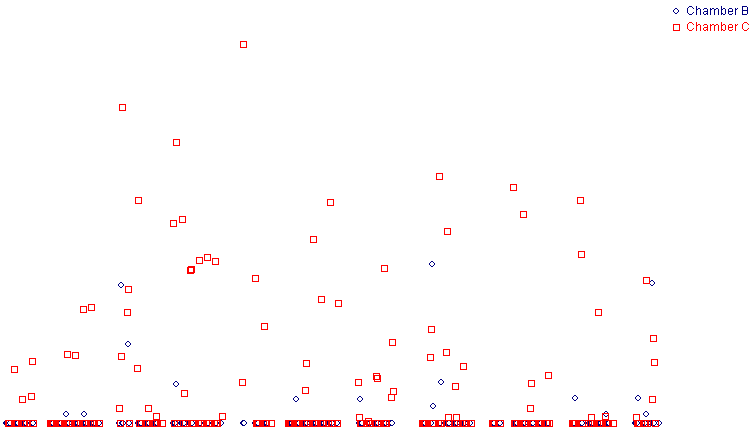
Figure 1: SmartFDC anomaly scores visualized in Report Viewer. Anomaly detection flagged Chamber C frequently and Chamber B occasionally.
A brief investigation into the time series data revealed the anomalies for both chambers were correlated. We found that the start of gas flow on one chamber impacted the gas flow on the other chamber (Figure 2). In general, Chamber C was impacted more Chamber B, and the site is currently investigating the gas delivery for the tool to determine if there is an impact to product.
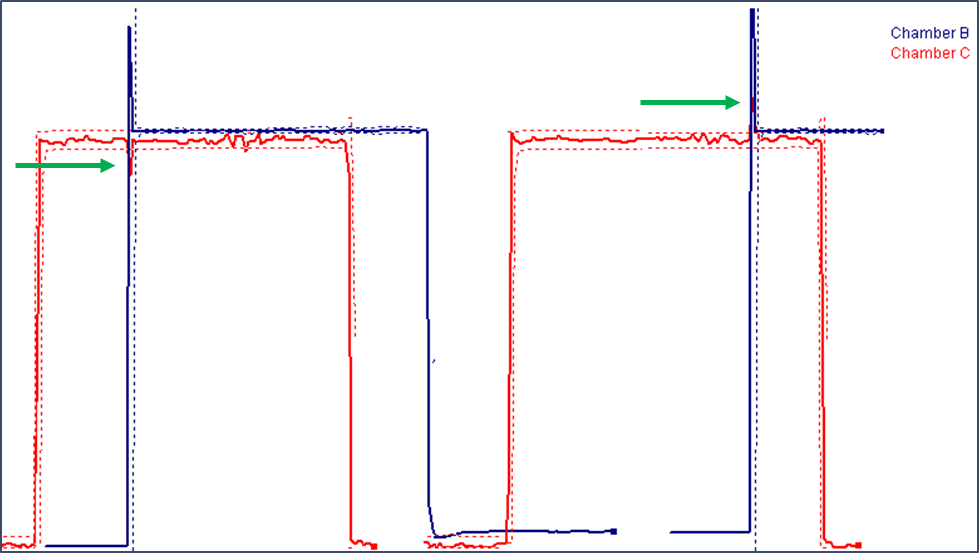
Figure 2: Chamber C's gas flow moves outside its envelope (dashed line) when Chamber B starts its gas flow, visualized in Multi Run Viewer.
The detected anomaly is sometimes subtle, but still easily seen in the SmartFDC UI (Figure 3). The variation in anomaly scores is likely due to the data acquisition speed. The sampling frequency may be too slow to consistently observe the full dynamic disruption in Chamber C gas flow when Chamber B's gas flow starts.
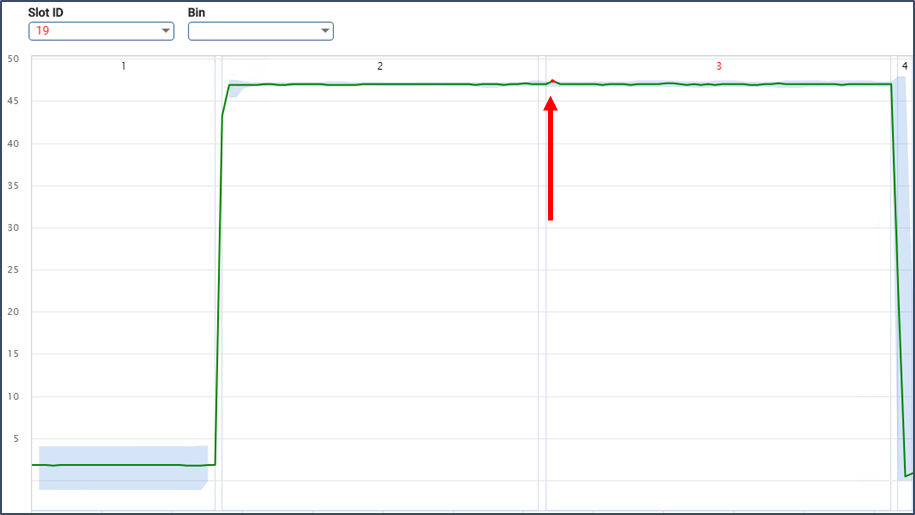
Figure 3: The SmartFDC Web UI highlights even small disturbances from normal in red. The tool step, shown above, is also colored red if an anomaly is detected within the step.
Success 2: Backside He Anomalies
An offline version of SmartFDC Anomaly Detection is available to analyze existing time series data. This version of anomaly detection was used with data from an industry standard etch cluster tool as part of a root cause investigation.
First, we quickly trained an anomaly detection model from a set of data before the incident using 100 processes. The resulting model was then applied to the processes under investigation. Normalized anomaly scores were calculated, with zero representing non-anomalous processes and greater than zero representing the relative magnitude of anomalous processes (Figure 4).
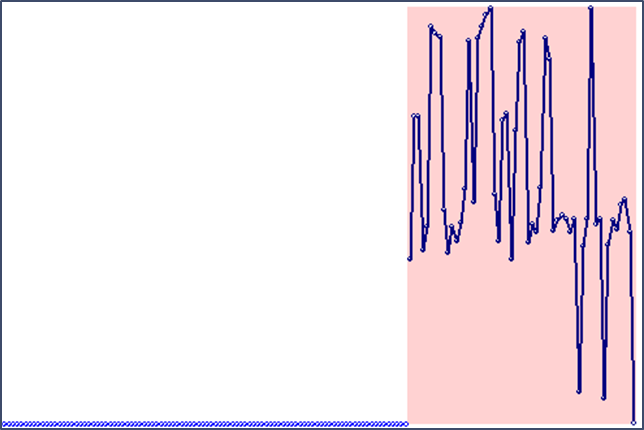
Figure 4: Anomaly scores showing the training data (light blue) from the week before on the left and the anomalous data (dark blue with red background) on the right.
Investigation into the time series data revealed issues with the Backside He Flow Rate. Figure 5 shows how traces with both subtle and obvious differences in shape during the process can be detected. For the cases where the anomaly scores are low, it is likely that the wafers are not being seated correctly on the chuck. For the cases where the anomaly scores are high, it looks like the wafers had difficulty maintaining constant contact all the way around the chuck.
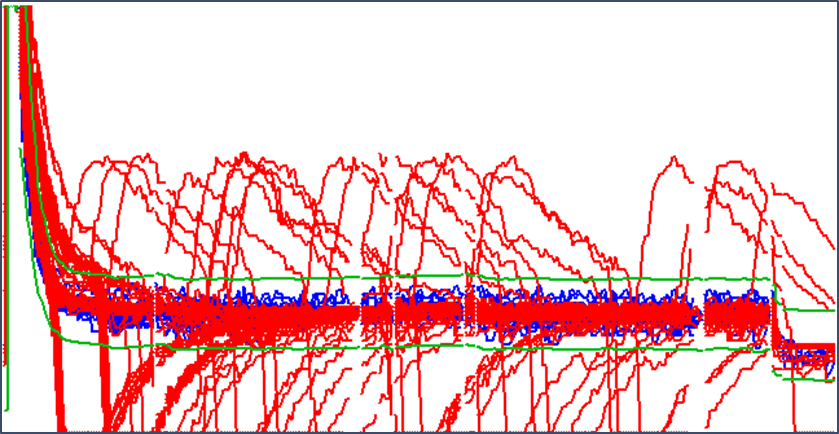
Figure 5: The training data (blue) were used to determine envelopes (green). Anomalous processes (red) included small deviations in the beginning and/or some large "burps" later in the process.
Summary
SmartFDC Anomaly Detection algorithms have been applied successfully to both run-by-run monitoring and root cause investigations. We look forward to continued development with our industry partners.