May 2018
FabGuard APC v5.00.03 Release »
Metric History in FabGuard Web »
New RGA Features beyond FabGuard version 854 »
FabGuard eOCAP Workflow Framework »
No Logistics from Tool or MES? Try Assigning Them from Signal Bin Logic! »
Understanding Host Name Resolution »
Change the Properties to Make Sure FabGuard Executive Runs as an Administrator »
FabGuard Auto Start and Windows Update Support for Windows 10 »
End-of-Life Support for FabGuard Versions and Microsoft Products »
Provide Increased Sensor Support and Factory Visibility of Operations with FabGuard v18.05.00
We are pleased to announce the release of FabGuard v18.05.00. The new version provides end users with guided troubleshooting, new dashboards, and greater sensor support to get more out of INFICON and 3rd party sensors.
In version 18.05.00, the development team has integrated portions of the FabGuard eOCAP system into FabGuard Help and FabGuard Explorer. Called FabGuard Guide, the system uses embedded procedures to guide users through common tasks, perform troubleshooting, and diagnose configuration issues. In this version, a block of RGA tuning procedures has been added to the system. Buttons labelled "Guide" in the user interface link to the relevant procedures (Figures 1 - 3). FabGuard Guide requires a web server to operate. The installers for FabGuard Help and FabGuard Explorer automatically enable and configure the Windows IIS web server during installation to support FabGuard Guide. Additional content will be added in future versions providing increased sensor and FabGuard operation support.
New throughput and capability metrics provide better visibility into equipment performance. End users obtain a better view of their overall factory capability. Modifications to FabGuard Web dashboards and the addition of a billboard style display give factories the ability to quickly asses the status of any process area.
Learn more about tools and processes with our enhanced sensor support and sensor integration capabilities. Maintain FabGuard and its fleet of sensors using the RGA tuning procedures integrated into FabGuard eOCAP.
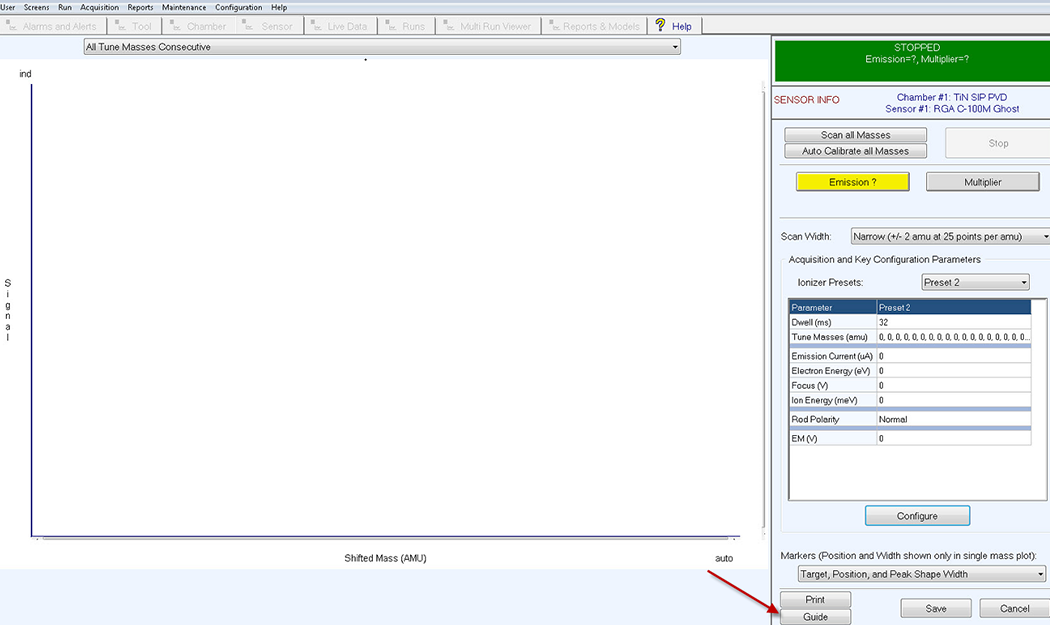
Figure 1: FabGuard Guide button in the Tune screen of FabGuard Acquisition. |
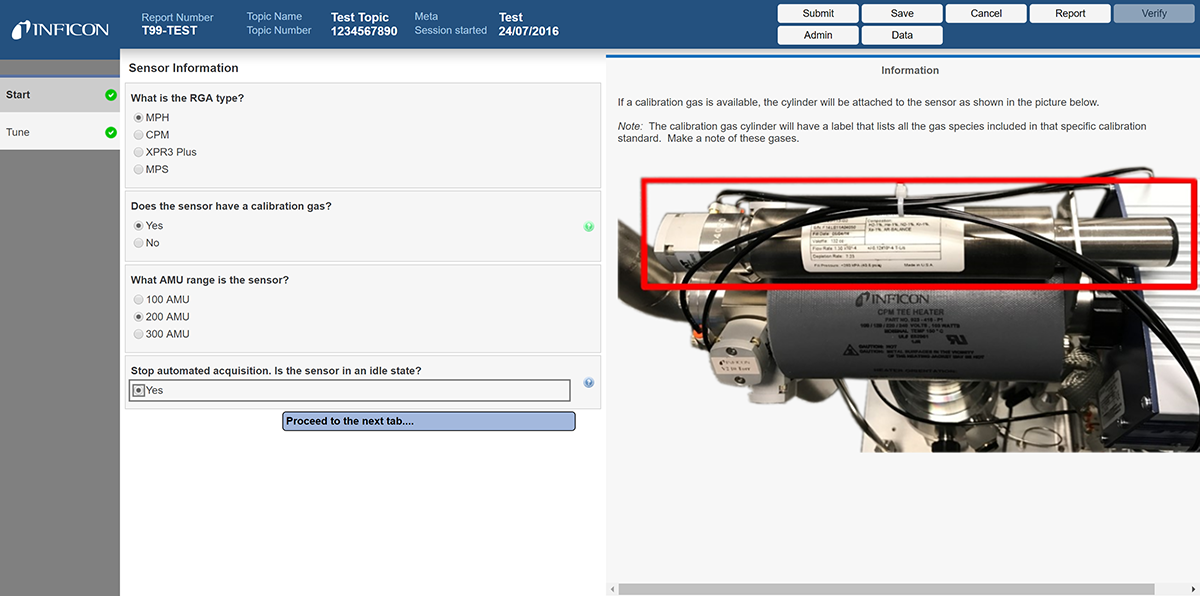
Figure 2: Sample RGA tuning guide with RGA image from FabGuard eOCAP. |
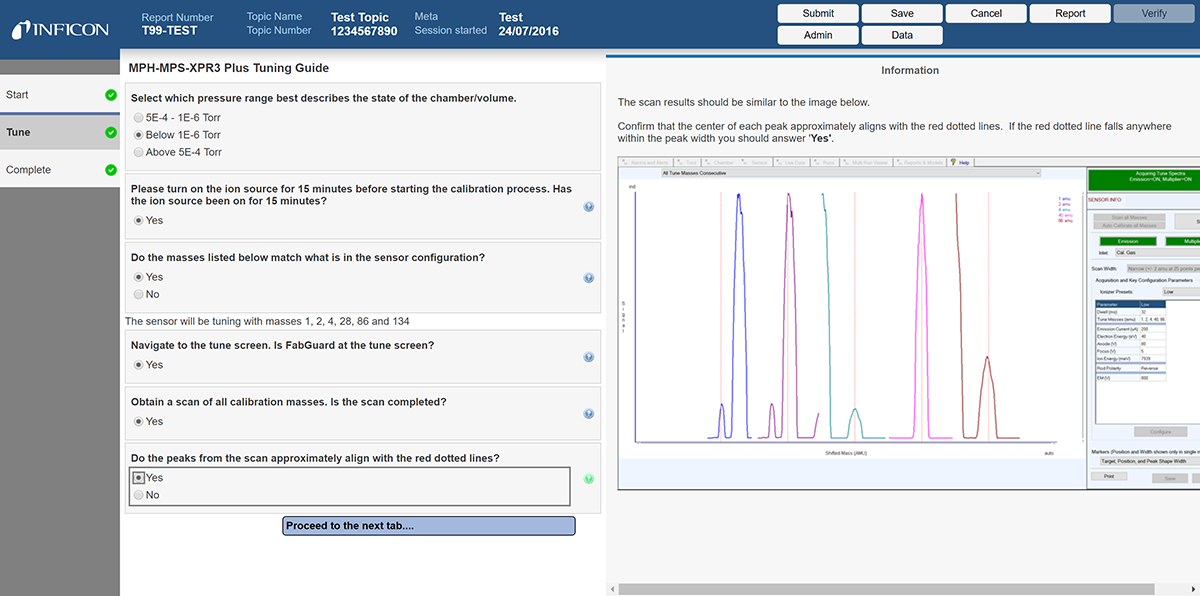
Figure 3: Sample RGA tuning guide with FabGuard image from FabGuard eOCAP. |
Key Features and Benefits
| Features | Advantages | Benefits |
|---|---|---|
Guided troubleshooting using FabGuard eOCAP |
Guides users through tasks and troubleshooting |
Complex or uncommon tasks are made easier and performed using expert guidance |
Web billboard display |
Real-time updates of tool group billboards for display on monitors across the factory |
Quick view of tool status without having to log in and manually look up status information |
Simplified plot right-click menus |
Moves all the “Show” choices into their own sub-menu. Combines “Grid” and “Legend” sub-menus into “Appearance” sub-menu. |
Simplifies menu choice and increases selection speed to help users get to data faster |
RGA external pressure reference used for calibration |
Allows more accuracy in calibrating total pressure |
User can calibrate the total pressure in the RGA using an external reference rather than a user entered value |
Highlighted Features
Features |
Descriptions |
|---|---|
Add Analysis Quality Summary report |
The Analysis Quality Summary report is a replacement for the Analysis Health rollup table. Includes: Two tables, one per Analysis, one per Tool/Chamber location |
Independent serial communication threads |
Keeps serial gauge/sensor communications intact even if one of the gauges is offline |
Support for NIDAQmx 17.6.0 |
Provides support for the latest NIDAQ drivers. Some older boards are no longer supported, see full release notes for details |
Edwards EcoLink/SECS as a SECS Gauge |
Supports collection of SVID data from devices that use Edwards EcoLink/SECS communication |
Thermoflex Chiller as a gauge |
Supports communication with Thermoflex chillers |
Display filament status in FabGuard (Transpector® MPx RGAs) |
Note that this requires that the Transpector MPx RGA be running firmware version 1.5.1 or higher |
Selectable Dark or Light theme for FabGuard Web |
Previously, only a Dark theme was available |
Allow Modbus/Serial Register to indicate what Function Code to use |
Add "(3)" to the end of the Register to use function 3 and add "(4)" to use function 4. If nothing is added, function 3 is used as the default selection |
In Executive web configuration add parameters for Capability |
Process capability is calculated using Cpk or CLR for every SPC and control report. For the dashboard bullseye plot, the worst Cpk or CLR is reported per Chamber on the Tool Overview tab, and per Tool on the Group Overview tab of FabGuard Web. |
Preference for TOI to get PPID from a database |
Enter the Connection Name in this field. The Connection Name is the name given in the setup in Report and Model Manager >> Advanced >> External Database connections |
Allow user to enter Auto Startup Delay in FabGuard |
For FabGuard IPM: Auto Startup Delay must be greater than or equal to 0 and less than or equal to 170 seconds. For FabGuard Executive: Auto Startup Delay must be greater than or equal to 0 and less than or equal to 290 seconds |
Add history plots for dashboard on the web |
History is available for Throughput, Utilization, Fault Rate, Coverage, and Configuration. The history plots appear when a user clicks on one of the small bar charts in the Executive Overview, Group Overview, or Tool Overview tabs on FabGuard Web |
Allow IPM restore via API |
Restore a failed FabGuard IPM PC automatically using an API to eliminate required human interaction |
Add DatabaseStatus to list of values reported by FabGuard Web service |
As with SecsStatus, DatabaseStatus is reported only if the request is for ChamberNumber=0, SensorNumber=0, SensorFunction=-1. The possible values returned by FabGuard are: 1.0 (Off), 2.0 (Not Connected), or 3.0 (Connected) |