May 2018
FabGuard APC v5.00.03 Release »
Metric History in FabGuard Web »
New RGA Features beyond FabGuard version 854 »
FabGuard eOCAP Workflow Framework »
No Logistics from Tool or MES? Try Assigning Them from Signal Bin Logic! »
Understanding Host Name Resolution »
Change the Properties to Make Sure FabGuard Executive Runs as an Administrator »
FabGuard Auto Start and Windows Update Support for Windows 10 »
End-of-Life Support for FabGuard Versions and Microsoft Products »
Metric History in FabGuard Web
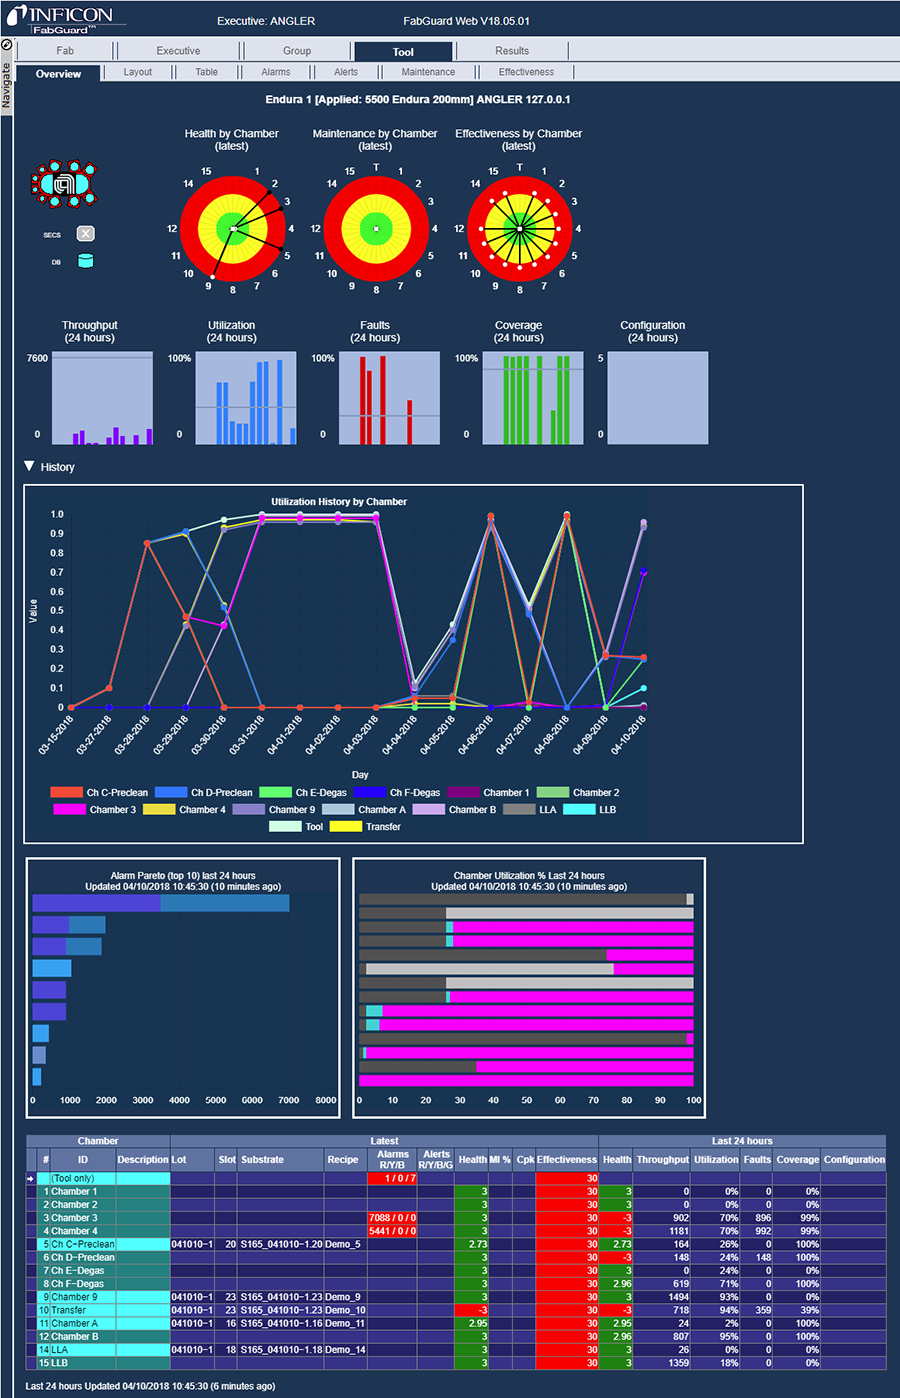
Figure 1: New bar charts and a corresponding history chart in the Tool Overview tab of FabGuard Web.
The FabGuard Product Group continues to improve the visualization capabilities of the Overview and Effectiveness tabs in FabGuard Web enabling quick assessments of process area and tool capability. History charts of Throughput and other metrics, including Effectiveness have been integrated into the Overview Tabs of FabGuard Web. A detailed description of the SPC Effectiveness metric can be found in the October 2017 FabGuard Application News.
The first change you will notice in Tool Overview, Group Overview, and Executive Overview is that speedometers for Throughput and other metrics over the last 24 hours have been replaced by bar charts, and a new bar chart has been added for Configuration (Figure 1).
Clicking one of the five small bar charts displays the history for that metric, in a panel below the charts. Show and hide this panel by clicking the triangle to the left of the word “History.” Clicking a different bar chart replaces the history display.
The color legend at the bottom of the history chart shows which trace corresponds to each Chamber (in Tool Overview), Tool (in Group Overview), or Group (in Executive Overview). Clicking a legend entry removes that trace from the plot so you can concentrate on individual Chambers, Tools, or Groups. Clicking the legend entry again will restore the trace to the plot.
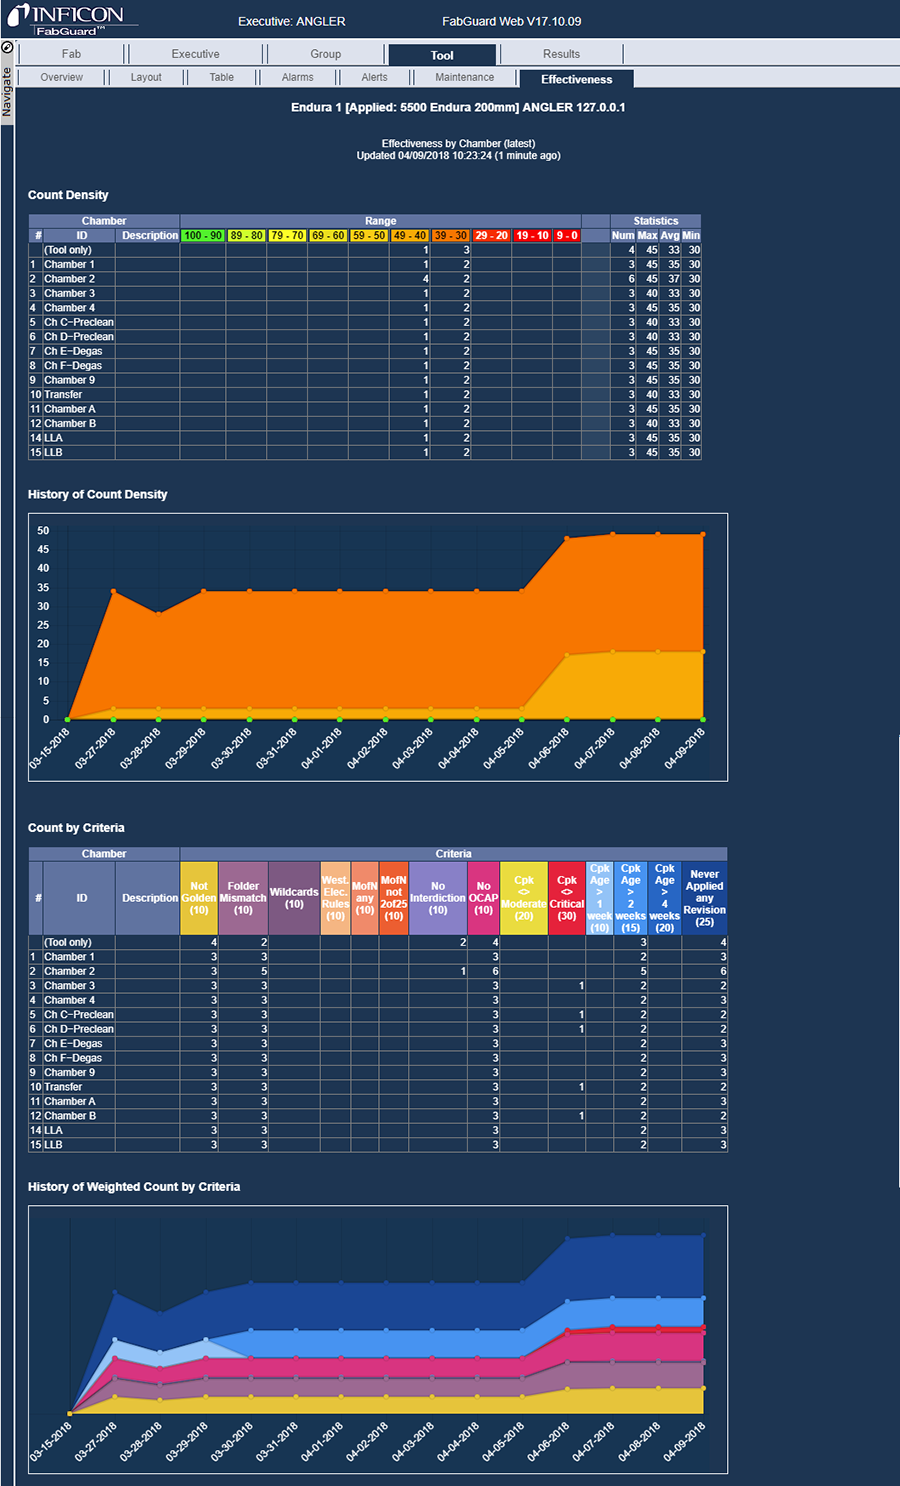
Figure 2: New history charts in the Tool Effectiveness tab of FabGuard Web.
Columns for Alerts, (minimum) Effectiveness, and Configuration have been added to the state table at the bottom of the page.
History plots were also added to the Tool Effectiveness, Group Effectiveness, and Executive Effectiveness tabs of FabGuard Web (Figure 2). History is plotted daily with a limit of 15 weeks. If multiple values were calculated because FabGuard Executive stopped and restarted, the last value for each day is used for history.
The new visualization capabilities of the Overview and Effectiveness tabs in FabGuard Web provide better visibility into equipment performance and the ability to quickly asses the status of any process area.