Mechanical Pump Health Monitoring
Background
FabGuard TDS-V data (3-axis piezoelectric accelerometer) and analysis provides real-time equipment vibration analysis and proven effective fault detection. When used in conjunction with synchronized tool data (TDS) and information provided by a standard mechanical pump diagnostics module, the fusion of data from three sources can provide a powerful equipment characterization, optimization, and predictive maintenance system.
Experimental
It is known that vibrations generated by mechanical vacuum pumps and other machinery may change during any given equipment service interval. Such changes in resonant frequency, amplitude, and phase relationships may be due to gradual and nominal wear of moving parts (e.g., normal bearing and seal wear, scoring of gear teeth, loss of lubricant, loosening of bolts, washers and other fasteners, etc.), or they may result from more immediate and dire problems that portend catastrophic equipment failure.
The objective of the current study is to first establish a multivariate “fingerprint” of a normally operating pumping system and – once its baseline behavior has been established – continue to monitor vibration, pump diagnostics and the tool (via SECS polling) as more severe problems develop, ultimately leading to unacceptable performance degradation, or outright failure.
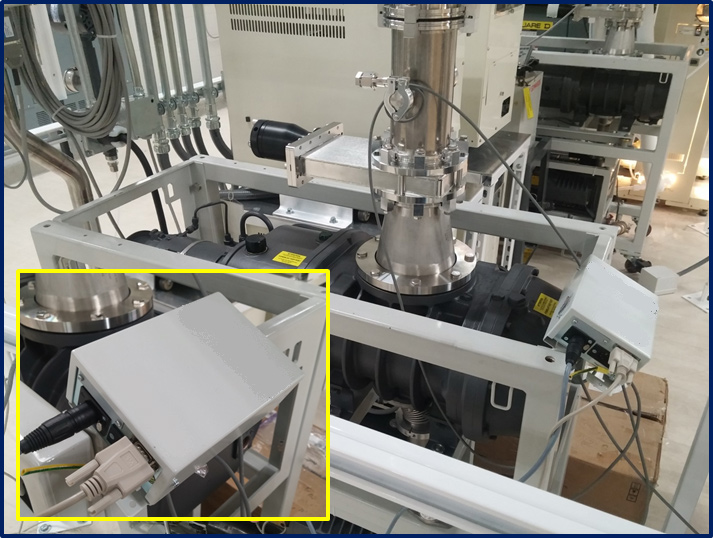
Figure 1: Pump serial communication module.
The system under study is a two-stage mechanical pump, consisting of a blower first stage, mounted on top of a screw type backing pump. The pump is used to evacuate a standard LPCVD TEOS deposition vertical furnace, with a batch capacity of six 8” wafer lots (25 wafers per lot). The process is regarded by the equipment engineer as being relatively dirty, with abrasive silicate particulates and unreacted precursor. Reaction by products are evacuated through the pumping system during the deposition process.
The pump was connected to the pump auxiliary data port (XLR connector), and the module was in turn connected via serial (RS-232) to the FabGuard IPM PC (Figure 1.)
The TDS-V 3-axis piezoelectric accelerometer was secured with a bolt to the stainless steel frame used to support and stabilize the pumps. The mounting position was chosen primarily for ease of access; however, it is not yet known whether the current off-axis (driveshaft) mounting location is optimal for detection of subtle higher harmonics and other resonances. Of the three commonplace methods of making physical connections to the sensor (i.e. magnetic, wax mount, and direct mechanical coupling), it is known that the last method is best for minimizing attenuation of higher frequency (>5 KHz) signals. Mounting of the actual TDS-V sensor used is shown in Figure 2.
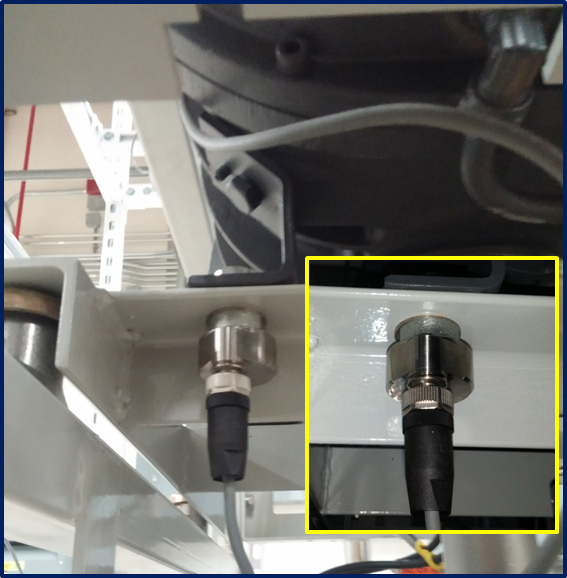
Figure 2: TDS-V Sensor bolt mounted to frame.
Once installed, the TDS-V was connected via a vendor supplied shielded cable to an active driver module, and the three breakout cables (one per axis) were connected to a shielded connector block, which in turn was connected to the IPM PC by way of a high speed PCI card. The sampling frequency was set at 10 KHz.
Analysis
Identifying reliable diagnostic signals and general optimization of the multivariate methodology is ongoing. It is known from work conducted by INFICON personnel that pump failure can be predicted by monitoring both vibrational amplitude excess kurtosis (time domain), as well as shifts in spectral position and magnitude of frequency domain signals. Also, in work conducted jointly with a major chip manufacturer it has been shown that using the pump diagnostics module to monitor various key pump parameters (current spikes, backing and booster pump power, pump temperature, exhaust and seal pressures) is likewise useful in monitoring the pump system condition. Trending of indicators away from established normal operating ranges provides a valuable tool for predicting likely failure, and for optimal scheduling of preventive maintenance.
Shown in Figures 3-8 are a number of analysis frames and scenarios currently being evaluated for use in a predictive model.
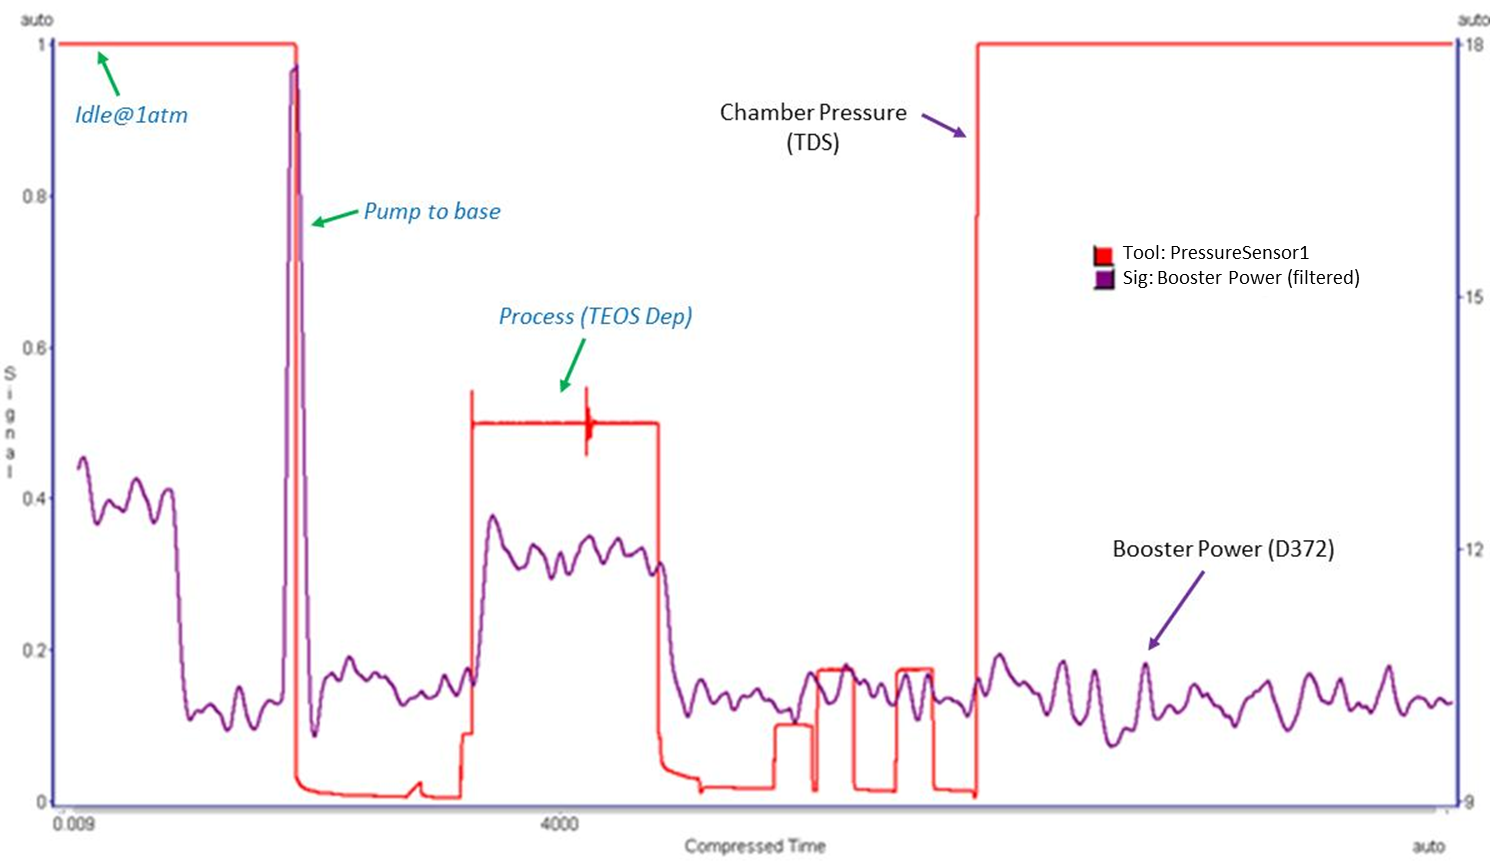
Figure 3: Pump power vs. pressure (time to base); Booster power (time above threshold).
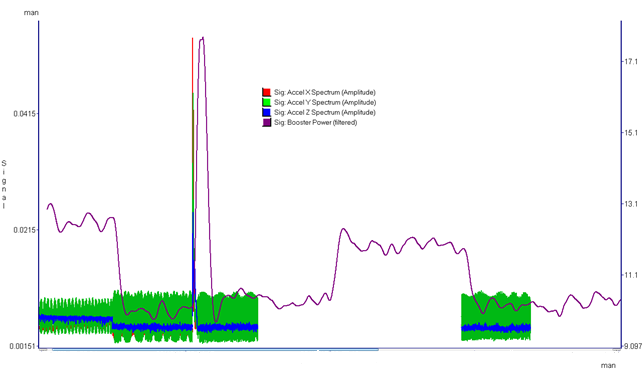
Figure 4: Acceleration (x,y,z) magnitude and envelope vs. booster power.
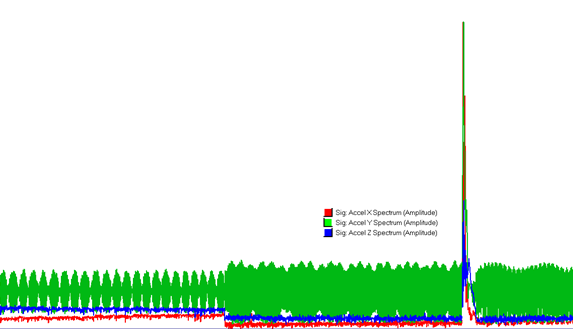
Figure 5: Acceleration (x,y,z) magnitude and envelope vs. booster power.
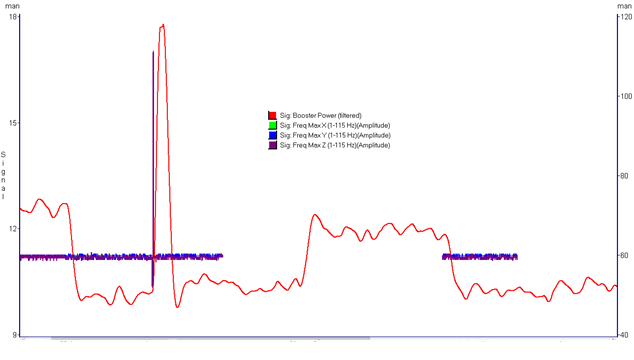
Figure 6: Frequency (x,y,z) shifts vs. booster power vs. time.
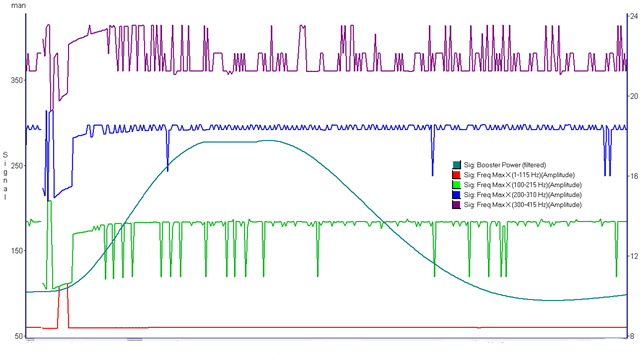
Figure 7: Frequency (x,y,z) shifts vs. booster power vs. time (spike + duration counters).
Next Steps
Once analysis has been refined and proven to be a reliable bellwether of pump failure, further improvements may result from adding one or more vibration or acceleration sensors, or by simply moving the existing TDS-V sensor to a better spot on the pump housing. Results will be reported in a future issue.