October 2017
SPC Effectiveness Metric: Are FabGuard Reports Working Correctly? »
Automatically Track Lot Processing Times for Industrial Engineering »
Automatically Calibrate Transpector® CPM RGA »
Modbus® TCP Connectivity in FabGuard »
Arc Detection using S-Probe Sensors on 200 mm High Density Plasma (HDP) Chambers »
Automatically Calibrate Transpector® CPM RGA
Background
RGA calibration and sensitivity can drift slightly over time. This leads to changes in the measured signals that do not correlate to changes in the external process conditions that are being monitored. Therefore, it is desired to have an automated method that periodically retunes the RGA for peak location and measurement sensitivity. This keeps the RGA signals at a given level corresponding to the associated gas species density in the process. The goal of this document is provide an example of a Transpector 2 CPM which performs a calibration on a monthly basis when FabGuard® determines the tool is idle. More specifically, the calibration tunes the instrument to verify that: 1) Known gas peaks are measured at the appropriate atomic mass unit (amu) and 2) The Electron Multiplier (EM) voltage is adjusted to maintain a consistent signal for a specific mass. The prototype Auto Calibration recipe was developed by INFICON Product Engineers and then implemented in a high volume manufacturing environment.
RGA Information
This development was performed using a Transpector 2 CPM 2.5 100 AMU running FabGuard IPM version 8.4.6-ae with calibration gas.
Minimum Requirements
FabGuard version 8.4.6 or higher with calibration gas.
I/O Setup
For the Tune and EM calibration to only occur once per month the following configuration items must be correct. Idle settings and acquisition triggers in the I/O are equally important and must represent the process. If not, the idle counter will not accurately depict the idle time of the process. If the I/O triggers are not correctly configured, then there is a high likelihood that the idle calibration will be interrupted. Additionally, this document will cover a monthly calibration, but the frequency of the calibration will vary depending on the utilization of the equipment along with process conditions being monitored. For example, the calibration might only be required on a quarterly basis based on prior RGA performance.
Idle Triggering
A time of 30 minutes in idle was chosen to initiate the auto calibration. Remember that this time is subjective and based on the process and the time between runs. Typically, idle times range between 15 and 60 minutes. If there are any natural time delays during normal processing that would exceed this time, it should be increased to a value that is larger so that the calibration does not start prematurely.
Idle 2 I/O Input Channel
The Idle 2 trigger is used to prevent the auto calibration from happening after every 30 minutes of idle time, Figure 1.
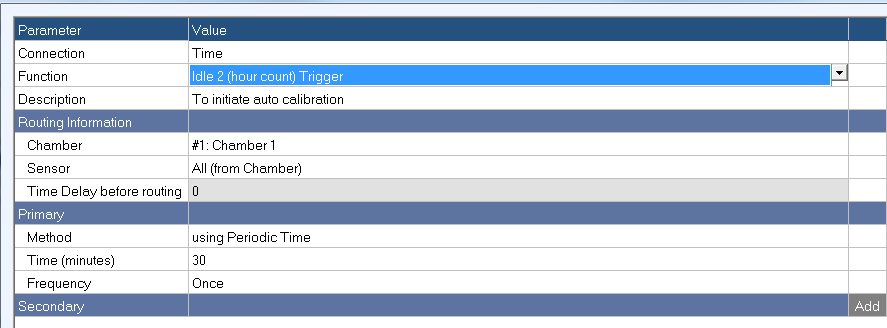
Figure 1: Common Idle 2 configuration in FabGuard.
To limit the Idle 2 trigger to only run once per 30 days (Monthly), the number of hours (720) highlighted in Figure 2 must be populated in Recipe Plan >> Advanced. If not, the auto calibration would occur after every 30 minute period of inactivity.
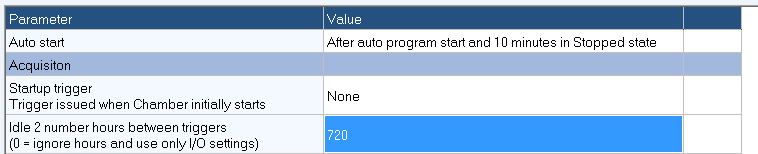
Figure 2: Limiting the Idle 2 trigger to run once per month is configured in Recipe Plan >> Advanced.
NOTE: The idle time starts to accumulate after a trigger regardless if it is a start or stop trigger. Therefore, if a run ends without a stop trigger (i.e. Max Points or Time in a run) and the Idle 2 time has been over 720 hours, the auto calibration recipe will run when it should not.
Auto Calibration Recipe Setup
The Tune and EM Gain Cal were combined into one recipe. This is possible when the time to complete the auto calibration recipe is not a concern, i.e. for manually loaded systems. For automatically loaded systems, the RGA is trying to monitor the time between the process runs (i.e. idle time) to find the best time to execute the auto calibration recipe. If the idle times are significantly variable, the length of the auto calibration recipe could be a concern. As a result, the length of the steps in the auto calibration recipe might need to be adjusted to shorten its execution time. Further explanation for each step in Figure 3 is provided below.
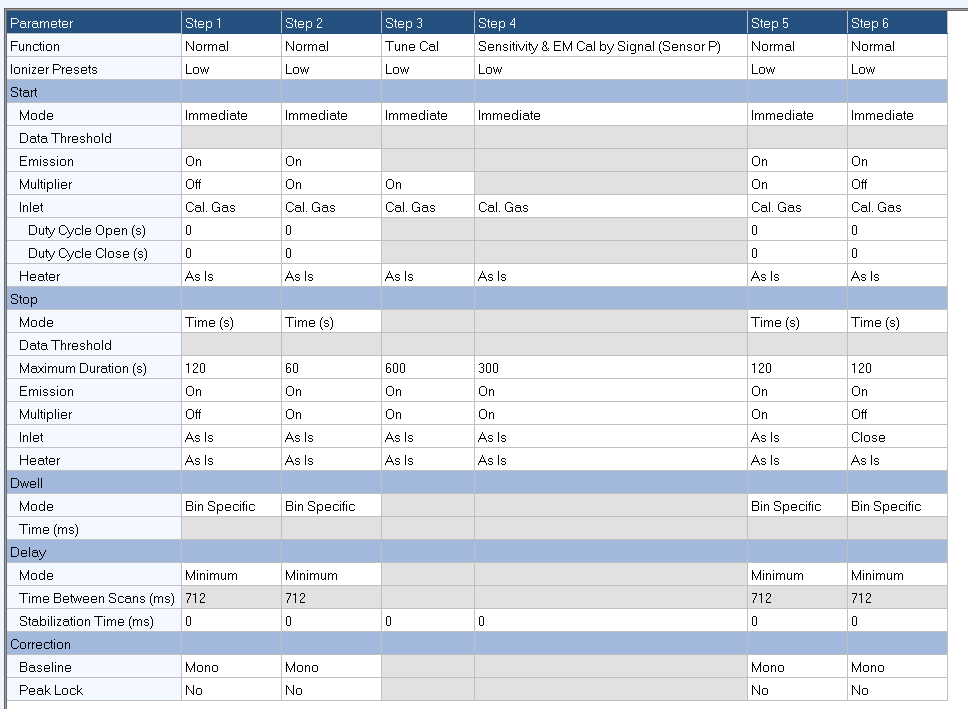
Figure 3: Auto Calibration recipe Acquisition Control screen.
Step 1
Open up the calibration gas and allow the emission to stabilize.
Step 2
Turn on the multiplier and allow it to stabilize.
Step 3
Tune using the masses in the calibration gas cylinder.
Step 4
Perform the EM and sensitivity calibration. Mass 28 was used for the EM calibration and sensitivity, Figure 4. The EM target was also lowered below the recommendation of 1e-8A to 5e-9A for this application to allow more room to adjust voltage with the life of the sensor.
- New sensors may need the EM target signal raised if a target of 1e-8A still produces an EM voltage below the minimum setting of 775 V.
- The Transpector CPM 3 and Transpector 2 CPM using FabGuard version 17.04.05 and above will have more options for Sensitivity and EM calibration. These options are not covered here.
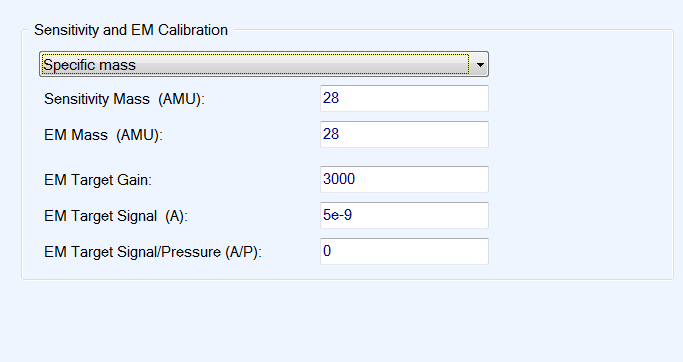
Figure 4: Sensitivity and EM calibration setup.
Step 5
Post calibration step used for tracking raw signals bin stats (i.e. N2) with EM on.
Step 6
Post calibration step used for tracking raw signals bin stats (i.e. N2) with EM off.
Bin Statistics
With Step numbers 1 and 2, and 5 and 6, the bin statistics for the N2 and He signals can be compared pre/post calibration and also compared with and without EM on. The preferred signals will be dependent on the process, any two masses should be sufficient.
Figure 5 displays the key bin statistics that were enabled for the Auto Calibration recipe. For He and N2 raw signals the pre/post calibration Steps were selected as well as trimming to ensure the signal was stable. For example, step 1 which is 120 seconds, trims the first 60 seconds to allow the signal to stabilize after the calibration gas is first introduced. The last 5 seconds were trimmed to eliminate any inconsistent data during step transition. Additional useful bin statistics are listed below:
- Ion Source Pressure
- Ionizer State
- Pump Speed
- RGA Sensitivity from Calibration – Reports the previous calibration value
- RGA EM Voltage – Reports the previous calibration value
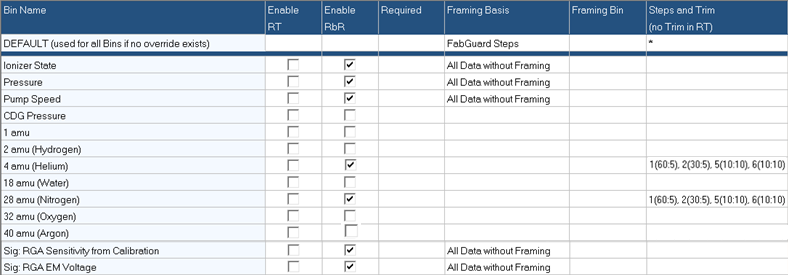
Figure 5: Auto Calibration recipe key Bin Statistics.
Calibration Health Monitoring
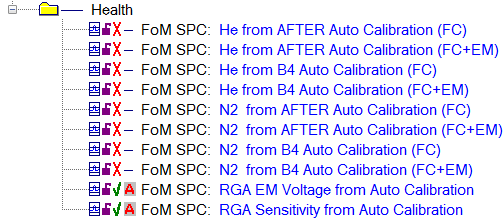
Report setup for RGA health monitoring.
The data from the auto calibration is not worthwhile unless it is tracked and charted. The SPC of a Figure of Merit Report comes with the entire suite of SPC charts which will allow you to monitor the specified figures of merit. An example of a set of reports used to monitor the health of the RGA is shown in Figure 6.
For in-between calibration monitoring, a signal to noise signal bin can be created in the recipe. The signal to noise bin was developed using an amu that is not present (such as 5 amu) and an amu which will almost always be present (such as 18 amu as most systems will contain trace amounts of water). If the amplitude of the noise is within a decade (signal to noise ratio of 0.1), the sensor is considered out of calibration. Unless is it known that the process conditions allow for the baseline water level to be within one decade of the sensor sensitivity level, then the sensor should be considered out of calibration and the appropriate repair implemented. Often, the ion source needs to be repaired or replaced.
Summary
Automated RGA calibration can periodically correct changes in the measured signals and provide maximum signal sensitivity with minimum intervention from equipment engineers.