October 2017
SPC Effectiveness Metric: Are FabGuard Reports Working Correctly? »
Automatically Track Lot Processing Times for Industrial Engineering »
Automatically Calibrate Transpector® CPM RGA »
Modbus® TCP Connectivity in FabGuard »
Arc Detection using S-Probe Sensors on 200 mm High Density Plasma (HDP) Chambers »
SPC Effectiveness Metric: Are FabGuard Reports Working Correctly?
There is a question continually asked of the FabGuard team: Is FabGuard working correctly? What the questioner means is: Is FabGuard doing what I think it should be doing? Unfortunately this is a challenging question to answer because FabGuard does not know what the user is thinking, only what FabGuard has been configured to do. From FabGuard’s perspective, FabGuard is always doing what it should be doing correctly. To provide visibility into this issue, an SPC Effectiveness Metric has been added to FabGuard to display the outcome of report configuration in a way that the user can more quickly determine if what they wanted is what they configured. This is a great way to error correct configurations and ensures that factory FDC is running optimally.
In general, FabGuard Web displays the state of each FabGuard IPM® in a concise form with the ability to access more detailed information through drill-ups, drill-downs, and launching of the FabGuard Client program. Key information is shown on the Overview tabs. The Overview tab for a selected Tool shows information per Chamber, for a selected Tool Group shows information per Tool, and for Executive shows information per Tool Group.
Eight performance metrics are used to summarize the state of each FabGuard IPM:
- Health: Latest value based on the last process in each Chamber.
- Maintenance: Latest fraction based on the latest maintenance information.
- Effectiveness: Latest measure of how Reports comply with 14 user weighted criteria.
- Process or Substrate Throughput: Number of processes or substrates in the last 24 hours.
- Utilization: Percent of total time spent processing in the last 24 hours.
- Faults: Percentage of processes or substrates with at least one fault in the last 24 hours.
- Coverage: Percent of Figures of Merit that are analyzed by at least one Report in the last 24 hours.
- Configuration Changes: Number of Recipes, Recipe Plans, and Report changes in the last 24 hours.
Previous articles have discussed Health, Maintenance, Throughput, Utilization, Coverage and Configuration. In this article we will focus on the new metric, Effectiveness.
SPC Report Definition vs. Instance
Before we discuss Effectiveness, we need to fully understand the difference between SPC Report definitions and instances. Generally, users refer to the definition of a Report, but in practice, a single definition can result in many Report instances. For example, a Report is defined to include both Tool 1 and Tool 2. This single definition will create two Report instances, one for Tool 1 and one for Tool 2. FabGuard IPM uses the View and Apply filters of enabled Reports to determine if a Report definition becomes a Report instance. If all location filters in a Report definition (Tool Group, Tool ID, Tool Description, Tool Area, Chamber Number, Chamber ID, and Chamber Description) match a FabGuard IPM, an internal instance of the Report is created on the FabGuard IPM. A single Report definition can apply to many chambers on many tools, creating many Report instances. If the Report definition has a historical split configured, a separate Report instance is created for each unique split. For example, if the history split applies the Report definition independently for each tool step, then a Report instance is created for each tool step.
The result is that there may be hundreds, thousands, or even millions of Report instances executed by the FabGuard IPMs in a factory. Each of the Report instances is completely independent: it will execute at a different time, have a separate history, calculate a separate Capability, and have separate Effectiveness.
SPC Report Capability
An additional concept we need to understand before discussing Effectiveness is SPC Report Capability. Capability is a measure of the applicability of the Report based on latest data used by the Report. Traditionally, Capability is a ratio of the Specification Levels and Standard Deviation of the last N data points (Cpk). Another measure of Capability uses a ratio of the Specification Levels and Quartile Range of the last N data points (CLR). There are other measures of Capability: T-test, F-test, Z, etc. (see FabGuard Help for definitions in the chapter on Analysis Health). In FabGuard, Cpk and CLR Capability measures are allowed for Effectiveness calculations, and the user can specify the number of data points to be used in the calculation. The default selections are Cpk and 100.
FabGuard allows a time limit to accumulate processes for the Capability calculation. For example, if only 70 processes occurred in the last 24 hours, FabGuard can be configured to still calculate Cpk or CLR for those 70 processes. FabGuard will also generate an alarm if there are no processes within user configured time.
The Effectiveness Measure
Effectiveness is a measure of how every Report instance complies with a set of Effectiveness Criteria. A perfect Effectiveness score is 100. Every violation of Effectiveness Criteria subtracts a user configurable deduction from Effectiveness. Note that the sum of the configured deductions can be greater than 100, however, the lowest Effectiveness score is floored at zero.
There are currently 14 criteria:
- Not Golden
- Folder/Outcome mismatch
- Apply filters contain wildcards
- Western Electric Rules enabled
- M of N not 1-of-1
- M of N not 1-of-1 or 2-of-25
- No Interdiction
- No OCAP
- Capability outside Moderate Level
- Capability outside Critical Level
- Capability calculation older than one week
- Capability calculation older than two weeks
- Capability calculation older than four weeks
- Report never applied for any revision
The first 8 criteria are based on the Report definition; every instance of the Report will have the same deductions based on these criteria. The last 6 criteria are based on the Report instance specific calculation of Capability.
Calculation and display of Effectiveness is part of the FabGuard Executive background processes. Specifically, it is part of OEE calculations. If the user enables background OEE in the Global Preferences Web tab, Effectiveness is automatically calculated and displayed on the Web in both Overview and Effectiveness tabs for Tool, Tool Group, and Executive. Background OEE calculation is also responsible for calculation of Throughput, Utilization, number of Configuration changes, etc., basically anything that pertains to Overall Equipment or FabGuard Effectiveness.
Effectiveness is shown is several locations. Key information is shown on the Overview tab and detailed tables are shown in the new Effectiveness tab. On the Overview tab, Effectiveness is shown as a bullseye plot and in the summary table column, Figure 1.
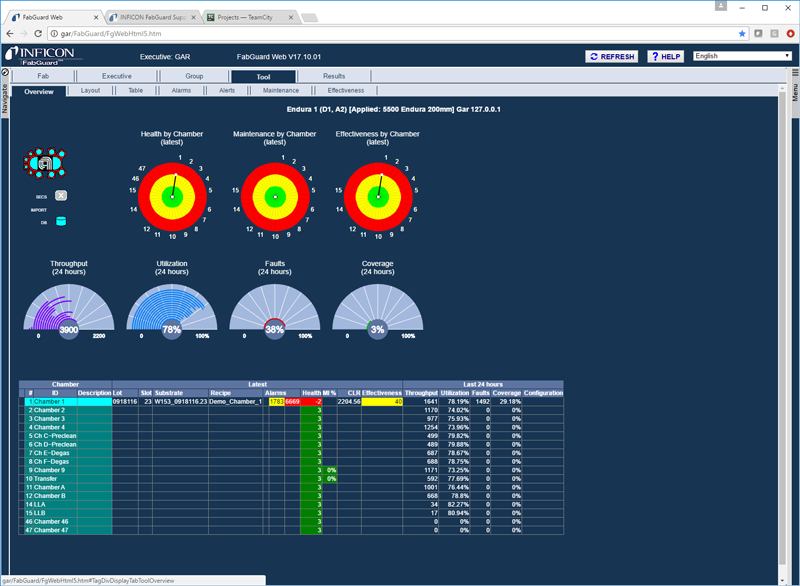
Figure 1: Effectiveness bullseye plot on the Tool Overview tab of FabGuard Web.
On the Effectiveness tab there are two tables: the first shows the number of Reports for a specific Effectiveness range, the second shows the number of Reports that violated specific criteria, Figure 2.
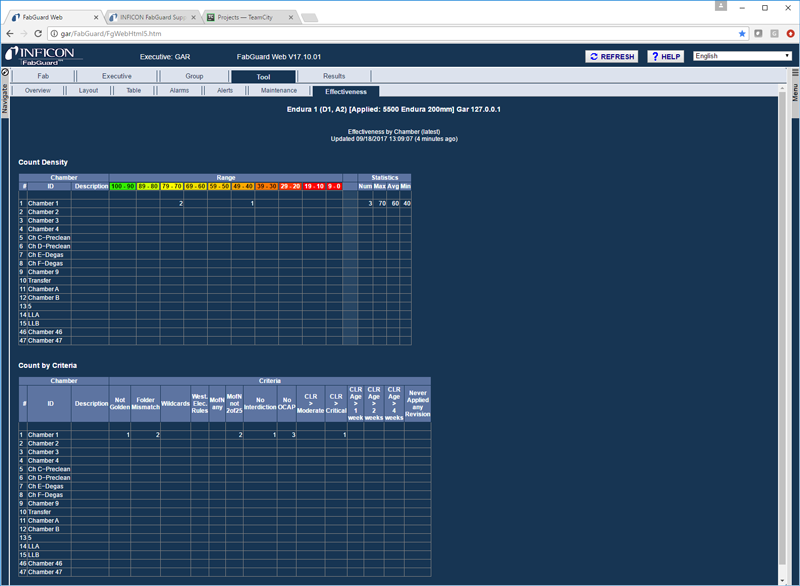
Figure 2: Detail tables showing the number of Reports violating the Effectiveness criteria on the Tool Effectiveness tab of FabGuard Web.
Clicking on any number in a cell will perform a drill down to a table of Reports instances that contributed to the count, Figure 3.
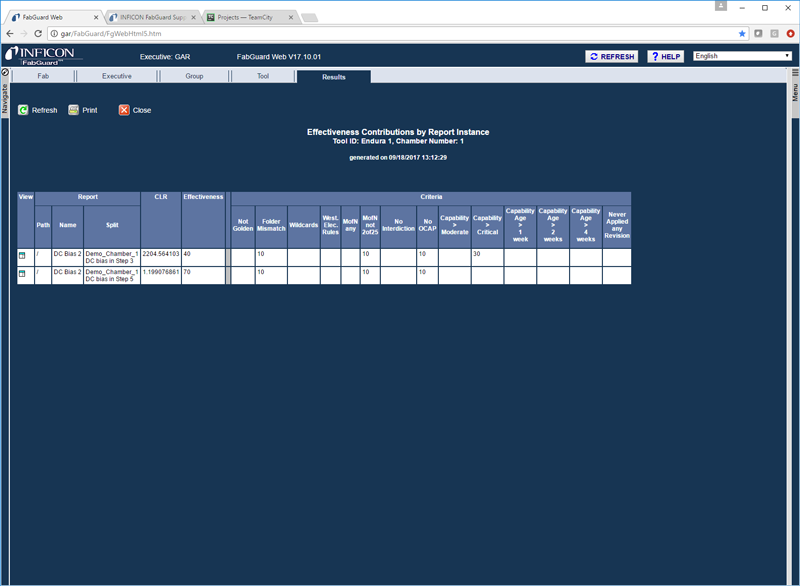
Figure 3: Drill down result from clicking a table cell in the Tool Effectiveness tab of FabGuard Web.
How to use Effectiveness
When Reports are correctly configured, the Effectiveness tables should have values only in the 100-90 column. This indicates that every Report instance is configured according to the factory specified criteria and Capability values. If there are numbers in other columns, the user can investigate which Reports do not comply and which criteria were violated. Effectiveness viewed from the Executive tab can identify a Tool Group that has an issue. Switching to the Tool Group tab can identify an individual Tool that has an issue. Switching to a specific Tool tab can identify a Chamber with Effectiveness violations.
It is important to note that Effectiveness calculations are only available visually as part of the dashboard. Effectiveness calculations are not analyses and cannot send alarms. Also, there is no static Effectiveness report than can be sent via email. Effectiveness is a quick indication that something unintended is happening in the system.
Summary
The new SPC Effectiveness metric will be able to help users quickly determine if their configured reports are compliant with their factory standards. When FDC is running optimally, a factory has the greatest protection against loss of product and productivity.
Acknowledgments
Effectiveness was originally designed by Freescale™ Semiconductor and generously shared with INFICON to be used in the FabGuard family of products. We are very grateful for all the work Freescale put in to the design of the CLR Capability formulas, Effectiveness criteria, and Effectiveness display.