Coverage Metrics in FabGuard Web
One of the key metrics for monitoring the efficacy of an FDC system is the Coverage, i.e. an understanding of how much of what is being measured is actually being analyzed. The Coverage metric is critical to understanding how well an FDC system is configured. Changes in the Coverage, especially decrease in Coverage, quickly indicate that the FDC system is not doing its job.
Unfortunately, there are many specific definitions of Coverage. The classic definition is: number of variables analyzed divided by total number of variables acquired. Unfortunately, due to the existence of a large number of intermediary virtual variables, temporary variables, and exploratory analyses, the classic definition of Coverage is not always useful. Furthermore, in some cases it is better to track coverage from the point of view of a process or substrate, i.e. number of processes/substrates with at least one analysis applied divided by total number of total processes/substrates, than from the point of view of variables.
Background
To understand the different ways to calculate Coverage, let's review the definitions of key terms.
Figure of Merit (FOM)
Time series data is collected from a tool and stored in a recipe bin. An FOM is a summary of recipe bin data. For example, number of points, minimum, maximum, average, standard deviation, etc. FOMs can be configured in a recipe or in a statistics model.
Process
A process is a single execution of data collection using a recipe. This results in the production of a FabGuard run file. If a specific wafer is processed twice in 24 hours, it counts as two processes.
Substrate
A substrate is a specific wafer that has been processed. The unique identifier for substrate can be obtained using the Substrate ID logistic. If this is not available, then Lot ID + Slot ID is used to create a unique identifier. If a specific wafer is processed twice in 24 hours, it is counted as a single substrate.
Interdicting
Interdicting means that an SPC report is configured to send an interdicting message to the tool or host. Typically, this interdiction message is used to stop a Chamber or a Tool when a fault has been detected.
Required
Required means that the recipe bin from which the FOM was calculated is required to be analyzed by an SPC report. Required bins are those that engineers have decided must be analyzed to maintain quality. A bin can be designated as required for SPC analysis in the Bin Statistics configuration of Recipe Setup.
Configuration
FabGuard calculates and keeps histories of all underlying values required to calculate Coverage (sum of all analyzed FOMs, sum of all processes, etc.) thus allowing the customer to select any of the 12 Coverage definitions (Table 1). The selection is performed in Global Preferences and should reflect what the factory believes is the most useful coverage definition based on what and how the factory manufactures.
To select a Coverage definition, navigate to:
Global Preferences >> Web >> Background Information Generation >> Coverage source
Option |
Description |
|---|---|
Figures of Merit Analyses |
Number of FOMs analyzed by an SPC Report divided by total number of FOMs acquired |
Figures of Merit Interdicting Analyses |
Number of FOMs analyzed by an SPC Report configured to send an interdicting message to the tool or host divided by total number of FOMs acquired |
Figures of Merit Required Analyses |
Number of FOMs marked as required and analyzed by an SPC Report divided by total number of FOMs acquired |
Figures of Merit Required Interdicting Analyses |
Number of FOMs marked as required and analyzed by an SPC Report configured to send an interdicting message to the tool or host divided by total number of FOMs acquired |
|
|
Process with at least one Analysis |
Number of processes with at least one FOM analyzed by an SPC Report divided by total number of processes |
Process with at least one Interdicting Analysis |
Number of processes with at least one FOM analyzed by an SPC Report configured to send an interdicting message to the tool or host divided by total number of processes |
Process with at least one Required Analysis |
Number of processes with at least one FOM marked as required and analyzed by an SPC Report divided by total number of processes |
Process with at least one Interdicting Required Analysis |
Number of processes with at least one FOM marked as required and analyzed by an SPC Report configured to send an interdicting message to the tool or host divided by total number of processes |
|
|
Substrate with at least one Analysis |
Number of substrates with at least one FOM analyzed by an SPC Report divided by total number of substrates |
Substrate with at least one Interdicting Analysis |
Number of substrates with at least one FOM analyzed by an SPC Report configured to send an interdicting message to the tool or host divided by total number of substrates |
Substrate with at least one Required Analysis |
Number of substrates with at least one FOM marked as required and analyzed by an SPC Report divided by total number of substrates |
Substrate with at least one Interdicting Required Analysis |
Number of substrates with at least one FOM marked as required and analyzed by an SPC Report configured to send an interdicting message to the tool or host divided by total number of substrates |
Table 1: The 12 coverage calculations available in FabGuard and their explanations.
Figure 1 shows key metrics, including Coverage, available on the Overview tab. All calculations are based on a 24 hour period.
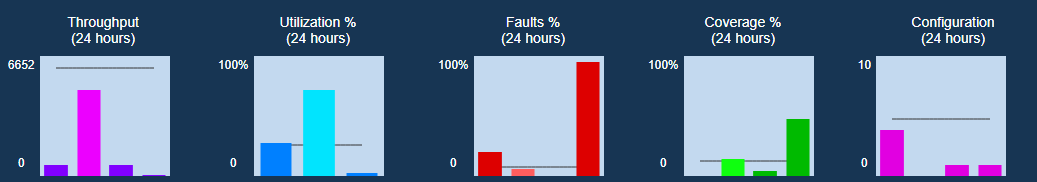
Figure 1: Key metrics available as bar plots on the Overview tab in FabGuard Web.
New Coverage Tab
Because a "one size fits all" display of Coverage is not always the best, version 19.05.00 added a new Coverage tab to FabGuard Web for each Tool, Tool Group, Server, and Executive. The Coverage tab is intended to show a more detailed view of Coverage. The Coverage tab always shows two sets of tables: the first focusing on Process Coverage and the second focusing on Figure of Merit Coverage. The specifics of which one of the four available coverage choices for each table is governed by the same Global Preference discussed above. For example, if the Global Preference is configured to show "Figures of Merit Interdicting Analyses," the first table on the Coverage tab is based on "Process with at least one Interdicting Analysis" and the second is based on "Figures of Merit Interdicting Analyses."
Figure 2 shows the Group Coverage tab in FabGuard Web. Because Coverage is shown at Tool Group level, each row represents a Tool.
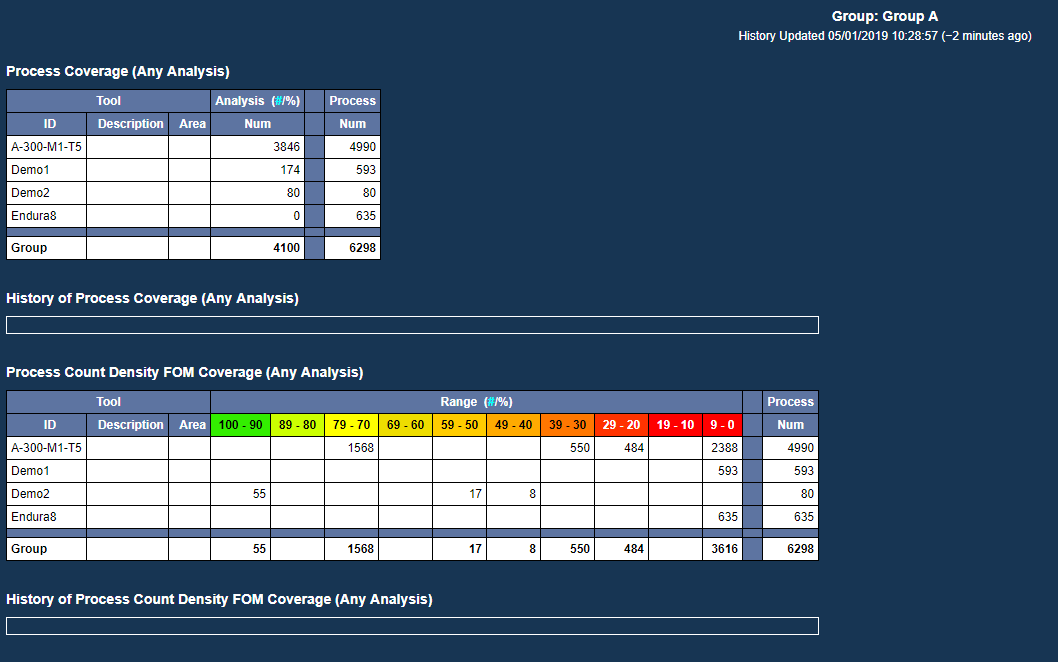
Figure 2: Group Coverage tab in FabGuard Web.
Process Coverage
The first table, Process Coverage, has two columns: (1) the number of processes for which at least one appropriate FOM is analyzed, and (2) the total number of processes. Depending which Coverage tab the user selected (Tool, Tool Group, Server, or Executive) each row represents a chamber, a tool, or a tool group. Clicking a row selects it in all web tabs and displays a 90 day history of the Coverage value for that row.
The History of Process Coverage plot shows history for the chamber, tool, or group selected in the table above it.
Process Count Density FOM Coverage
The second table, Process Count Density FOM Coverage, shows a distribution of the FOM Coverage values, with each row representing a chamber, a tool, or tool group. Each column represents a range of Coverage values and each cell contains the number of processes that fall into that range over the last 24 hours. The last column contains the number of process for each row over the same 24 hour period.
The History of Process Count Density FOM Coverage plot shows history for the chamber, tool, or group selected in the table above it.
Figure 3 shows the Process Count Density FOM Coverage in more detail, including an associated History plot for the tool.
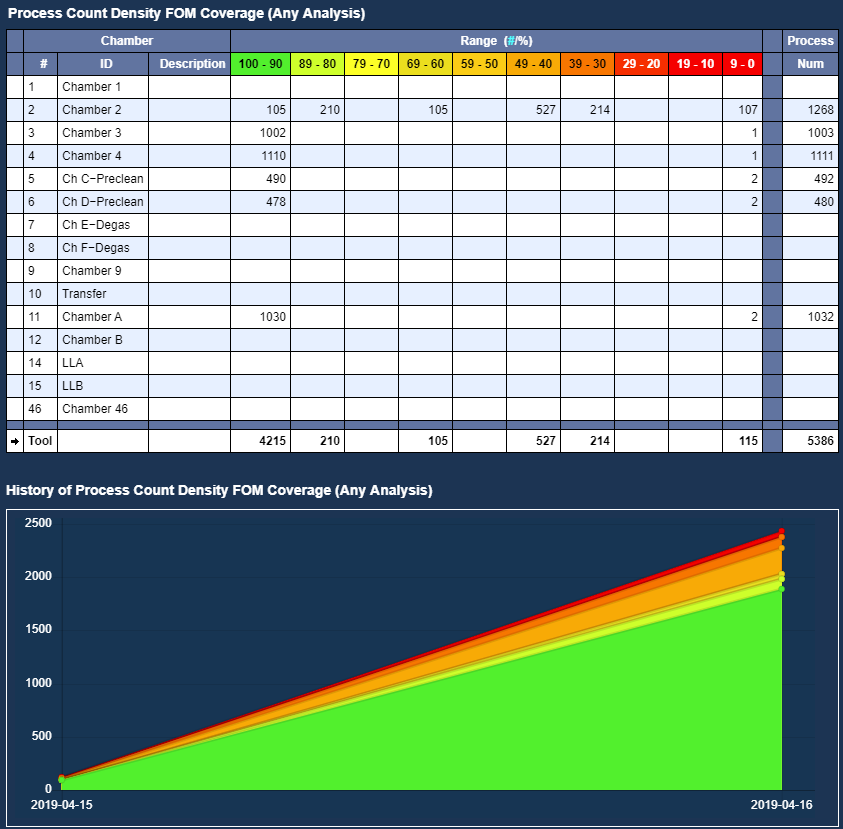
Figure 3: Process Count Density FOM Coverage table and History plot for a tool.
Summary
Configure and use the FabGuard Coverage metrics to quickly determine how much of what is being measured is actually being analyzed. Coverage metrics are an important tool for evaluating how well an FDC system is configured.