FabGuard Nodes (IPM, AS, IFM, IAM)
Introduction
FabGuard is a distributed system. Multiple computers acquire data and store it in a central database. These acquisition nodes are currently of four different types: IPM, AS, IFM, and IAM. Each type of FabGuard Node is optimized for a specific data acquisition and analysis need in the factory. They all connect to a central executive node. Customers access the system via FabGuard Web and FabGuard Client, both connected to FabGuard Executive.
There are two categories of acquisition node:
- Monitors accept I/O inputs representing data and events to be acquired and analyzed.
- Servers read files (no I/O) containing data to be acquired and analyzed.
FabGuard Node Types
- IPM (Integrated Process Monitor)
Category: Monitor
Purpose: Perform triggered acquisition, real time and run-by-run analysis
Process based
Communicates with equipment
Handles Maintenance events and Tool Alerts - AS (Analysis Server)
Category: Server
Purpose: Perform real time and run-by-run analysis on data read from files
Process based
No acquisition loop
Treats each internal Chamber as a Tool
MIs come from analysis, Alerts from file importers - IFM (Integrated Facilities Monitor)
Category: Monitor
Purpose: Perform semi-continuous analysis, chunked by configurable time intervals
No processes, therefore no Throughput or Utilization
Acq1 at start of interval, Acq5 for setup
Tool-centric: Has Tool Bins, EPIs, MIs, equipment-based triggers - IAM (Integrated Automation Monitor)
Category: Monitor
Purpose: Respond to Tool events by sending messages to FPS
No processes, acquisition, or analysis
Therefore, no Throughput, Utilization, or OEE
Tool-centric: No chambers
Responds to four events from Tool: Lot Start/End, Tool Process Start/End
I/O: SECS, RV, Interface A
General Features and Available Metrics by FabGuard Node
Table 1 summarizes the general features and metric calculations available for each type of FabGuard Node.
|
IPM |
AS |
IFM |
IAM |
|---|---|---|---|---|
Acquisition |
X |
X |
X |
|
Processes |
X |
X |
|
|
Tool |
X |
|
X |
|
Analysis |
X |
X |
X |
|
Health |
X |
X |
X |
|
Maintenance |
X |
|
X |
|
Utilization |
X |
X |
|
|
Throughput |
X |
X |
|
|
Faults |
X |
X |
X |
|
Coverage |
X |
X |
X |
|
Configuration |
X |
X |
X |
X |
Effectiveness |
X |
X |
X |
|
Table 1: General features and metrics by FabGuard Node type.
For reference, a brief description of each metric is included in Table 2.
Metric |
Calculated from |
Meaning |
|---|---|---|
Health |
Process + Analysis |
Normalized distance to target: How good the process is |
Effectiveness |
Health + Analysis |
How good the analysis is |
Throughput |
Process |
Processes per unit of time |
Utilization |
Throughput |
Percentage of equipment in use |
Faulted |
Process |
Percentage of processes with at least one fault |
Coverage |
Process + Analysis |
Fraction of FOMs that had at least one analysis applied |
Maintenance |
Analysis + (Acq or Tool) |
Fractional distance to a maintenance event |
Table 2: Definitions of metrics used in FabGuard.
Display in FabGuard Web
FabGuard Web displays different icons for each node type (Table 3).
|
IPM |
AS |
IFM |
IAM |
|---|---|---|---|---|
Executive Layout |
|
|
|
|
Tool Layout (upper left) |
|
|
|
|


Table 3: Icons used in FabGuard Web for each FabGuard Node type.
For IPM, IFM, and IAM, the Chambers are listed by default in Chamber Number order.
For AS, the Tools are listed by default in alphabetical order. Web replaces the word "Tool" with "Server" and replaces "Chamber" with "Tool." The Server Layout tab contains a grid of Tools belonging to the Analysis Server (Figure 9).
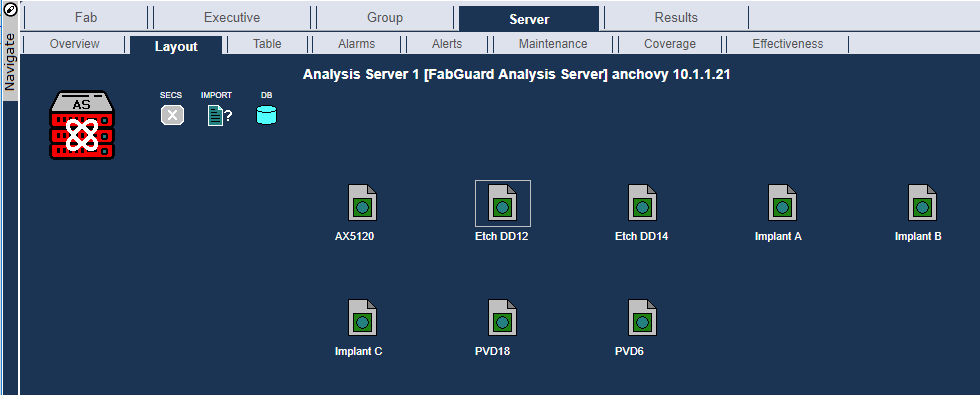
Figure 9: Server Layout tab of FabGuard Web showing the Tools connected to FabGuard AS.
On the bulls-eye plots in Server Overview, spokes are Tools instead of Chambers (Figure 10).
If you choose "Reports for Fab" and execute a Report, the Tool filter dropdown includes the ID's of all connected IPMs, IAMs, and IFMs, plus the Tools belonging to every connected AS. These are sorted together alphabetically. In this example, an IPM named "Endura 1" is connected to the Executive along with an AS containing several Tools (Figure 11).
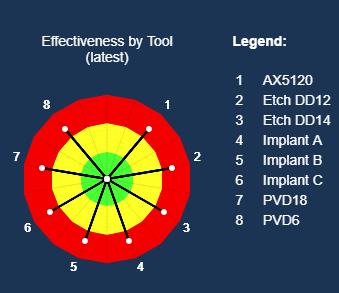
Figure 10: Bulls-eye plot in Server Overview showing the Tools connected to FabGuard AS. |
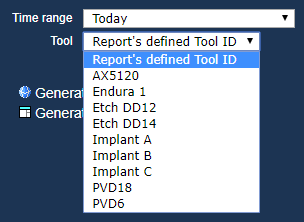
Figure 11: Tool filter dropdown for Reports that includes all FabGuard Node Tool connections. |
For IFM, the Tool Layout tab contains a grid of TDS sensor icons, one per Chamber (Figure 12).
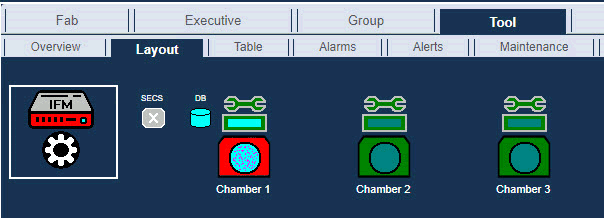
Figure 12: Tool Layout tab of FabGuard Web showing the Chambers configured for FabGuard IFM.
For IAM, there are no Chambers. There is a Tool Overview tab in web showing SECS and DB status, and a Tool Alarms tab (Figure 13).
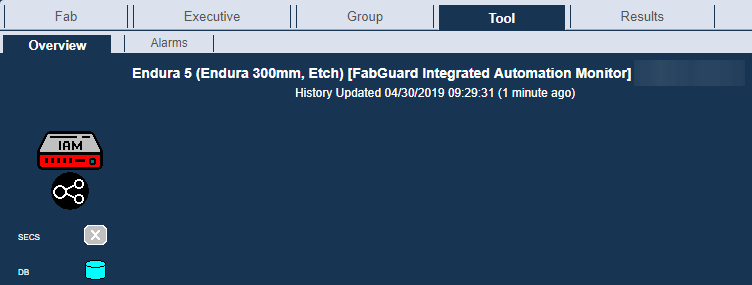
Figure 13: Tool Overview tab of FabGuard Web showing FabGuard IAM.
Summary
Each type of FabGuard Node is designed to provide the best possible data acquisition and analysis based on the specific factory application. Contact your local support engineer for assistance choosing the right FabGuard Node.